Fig. C.1
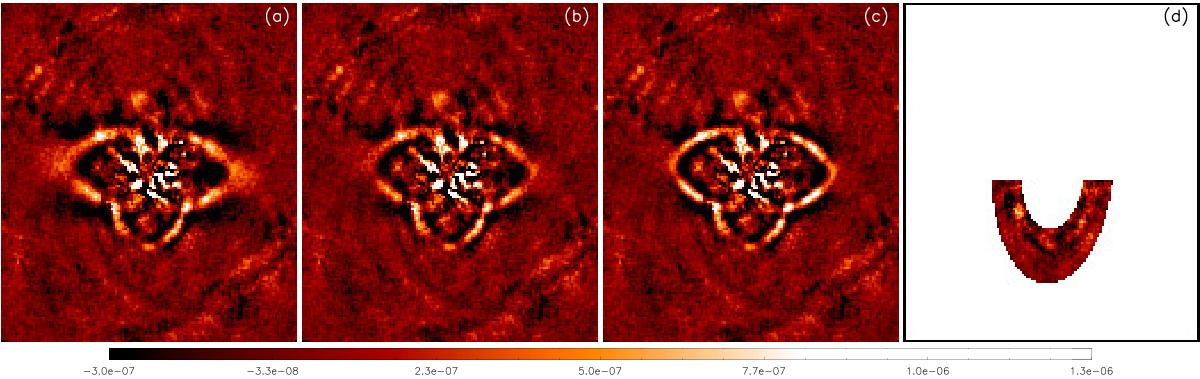
Comparison between the H2H3 image (vertical component) and disk models (horizontal component) with different values of αin and αout. a)αin = 5 and αout = −5; b)αin = 10 and αout = −10; c)αin = 20 and αout = −20. The inclination is set to 58° and the semi-major axis is set to 0.41′′. Panel d) shows the residuals after subtraction of the best model (αin = 20 and αout = −20).
Current usage metrics show cumulative count of Article Views (full-text article views including HTML views, PDF and ePub downloads, according to the available data) and Abstracts Views on Vision4Press platform.
Data correspond to usage on the plateform after 2015. The current usage metrics is available 48-96 hours after online publication and is updated daily on week days.
Initial download of the metrics may take a while.