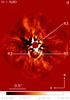
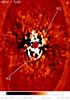
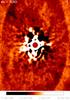
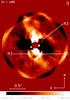
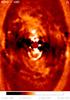
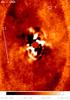
Fig. B.2
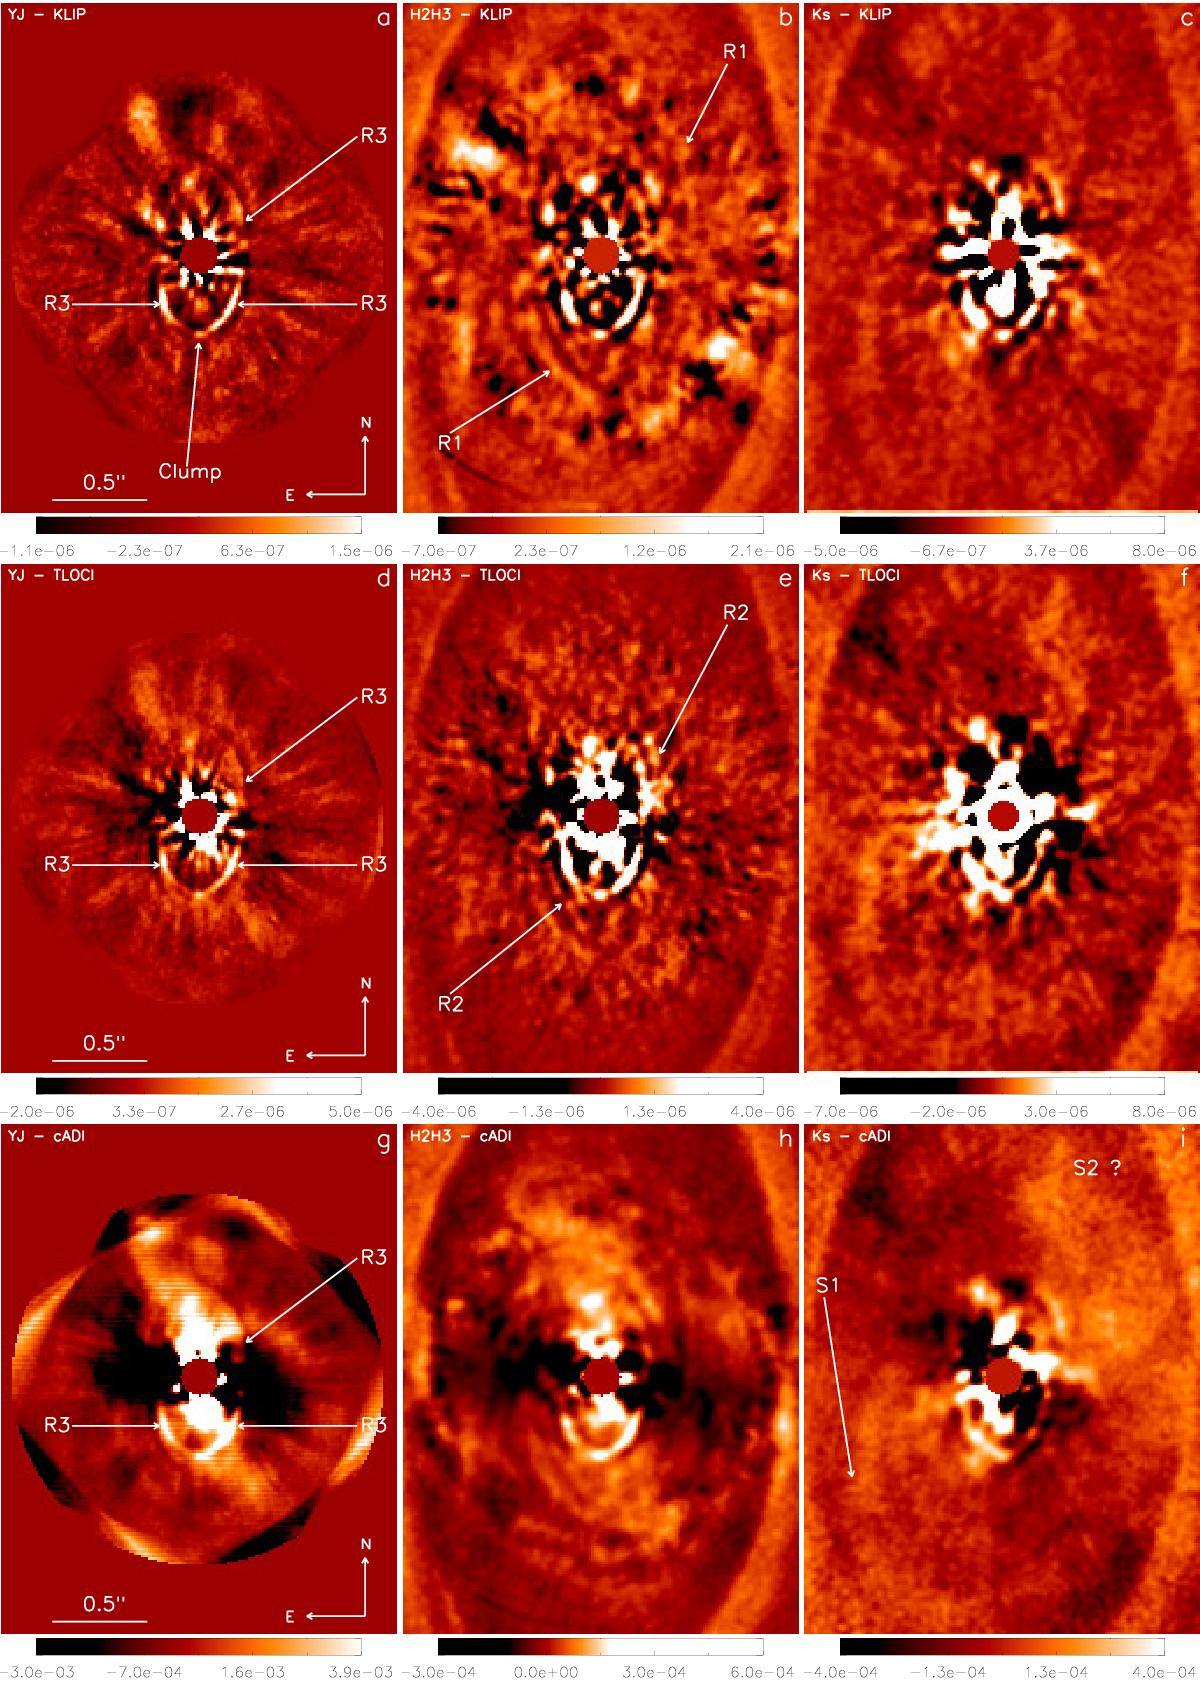
Images of the central part of the system in YJ (left column), H2H3 (middle column), and Ks (right column) bands with three differents post-processing: KLIP (top row), TLOCI (middle row), and cADI (bottom row). The cADI images are multipled by r to improve the visibility of structures. The annotations indicate structures R1, R2, R3, S1-S2, and the clump for a better identification.
Current usage metrics show cumulative count of Article Views (full-text article views including HTML views, PDF and ePub downloads, according to the available data) and Abstracts Views on Vision4Press platform.
Data correspond to usage on the plateform after 2015. The current usage metrics is available 48-96 hours after online publication and is updated daily on week days.
Initial download of the metrics may take a while.