Free Access
Fig. 2
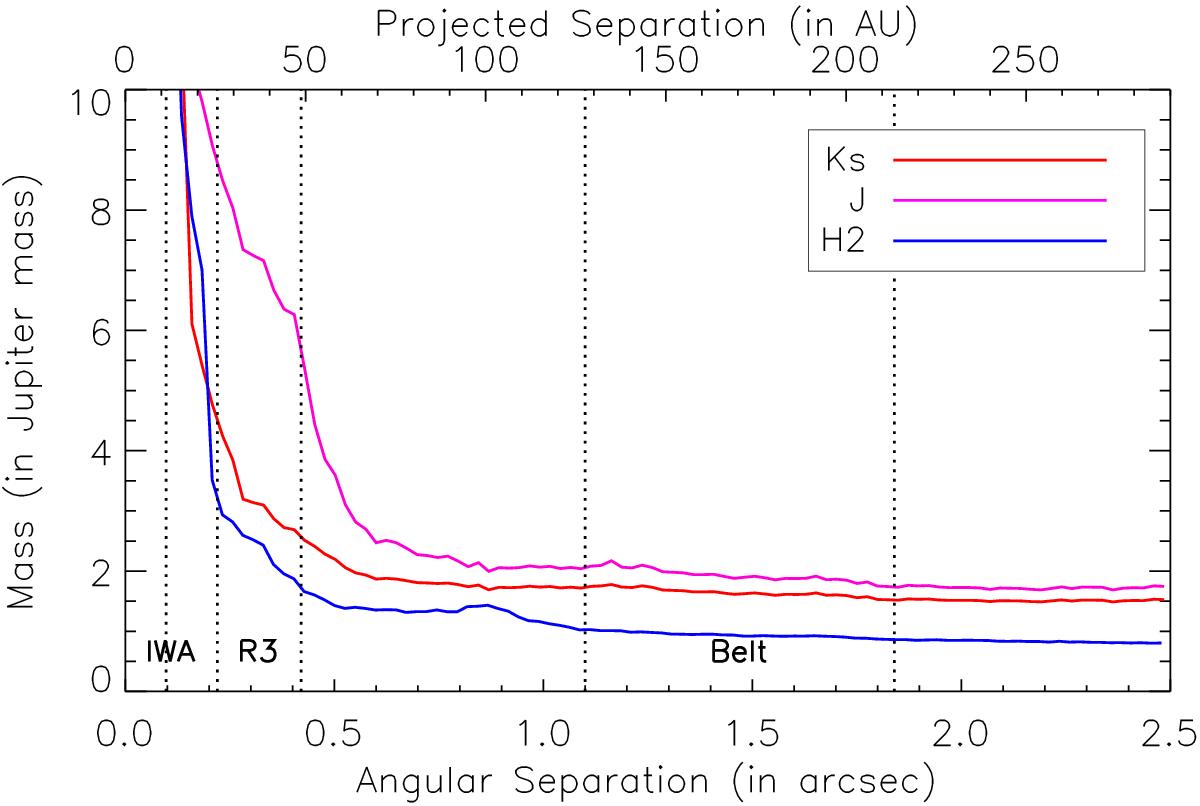
Detection limit in Jupiter mass for J, H2 and Ks-band, assuming the BHAC-2015+COND-2003 model. IWA is the inner working angle of the coronagraph. R3 and Belt represent the separation where the structures are located.
Current usage metrics show cumulative count of Article Views (full-text article views including HTML views, PDF and ePub downloads, according to the available data) and Abstracts Views on Vision4Press platform.
Data correspond to usage on the plateform after 2015. The current usage metrics is available 48-96 hours after online publication and is updated daily on week days.
Initial download of the metrics may take a while.