Free Access
Fig. 10
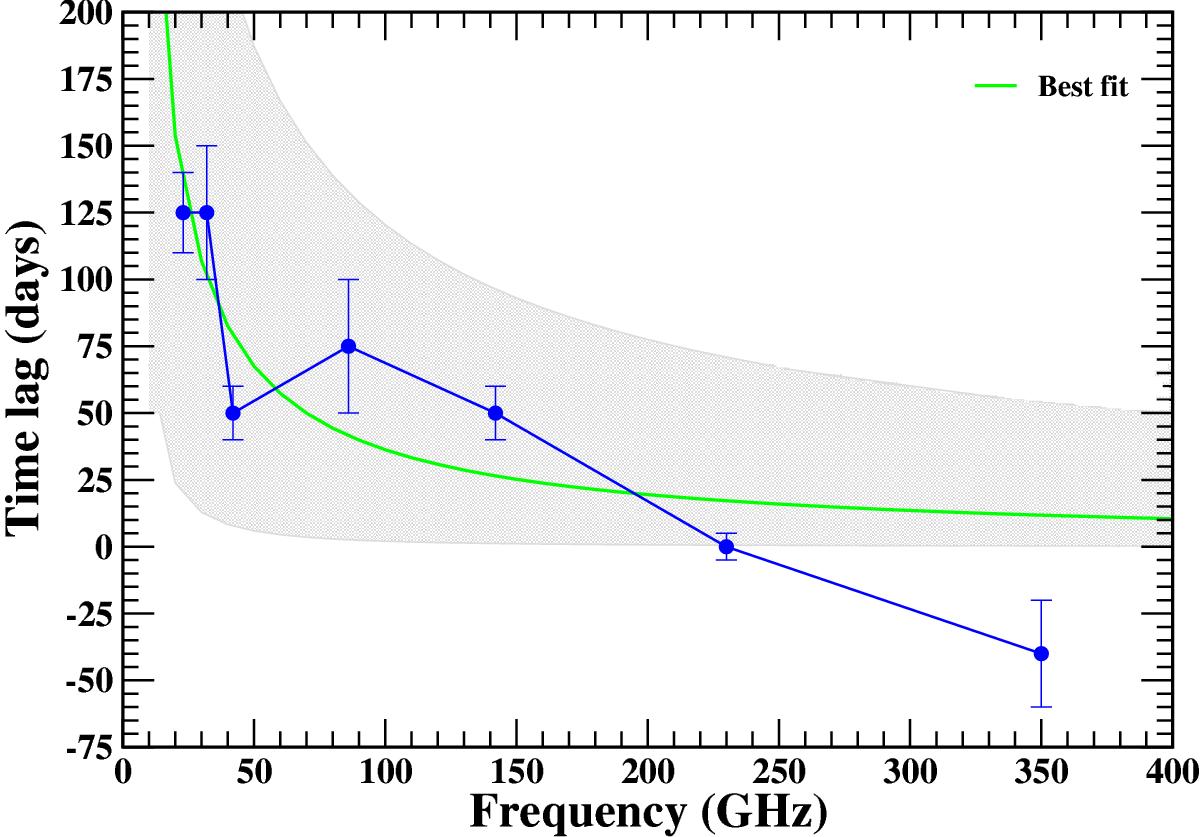
Time lag relative to the curve at 230 GHz plotted as a function of radio frequencies (in blue). The green curve represents the best power-law fit of the data points, with a slope of kr = 1.12 ± 0.46. The grey shaded area represents the error interval on the fit.
Current usage metrics show cumulative count of Article Views (full-text article views including HTML views, PDF and ePub downloads, according to the available data) and Abstracts Views on Vision4Press platform.
Data correspond to usage on the plateform after 2015. The current usage metrics is available 48-96 hours after online publication and is updated daily on week days.
Initial download of the metrics may take a while.