Fig. 1
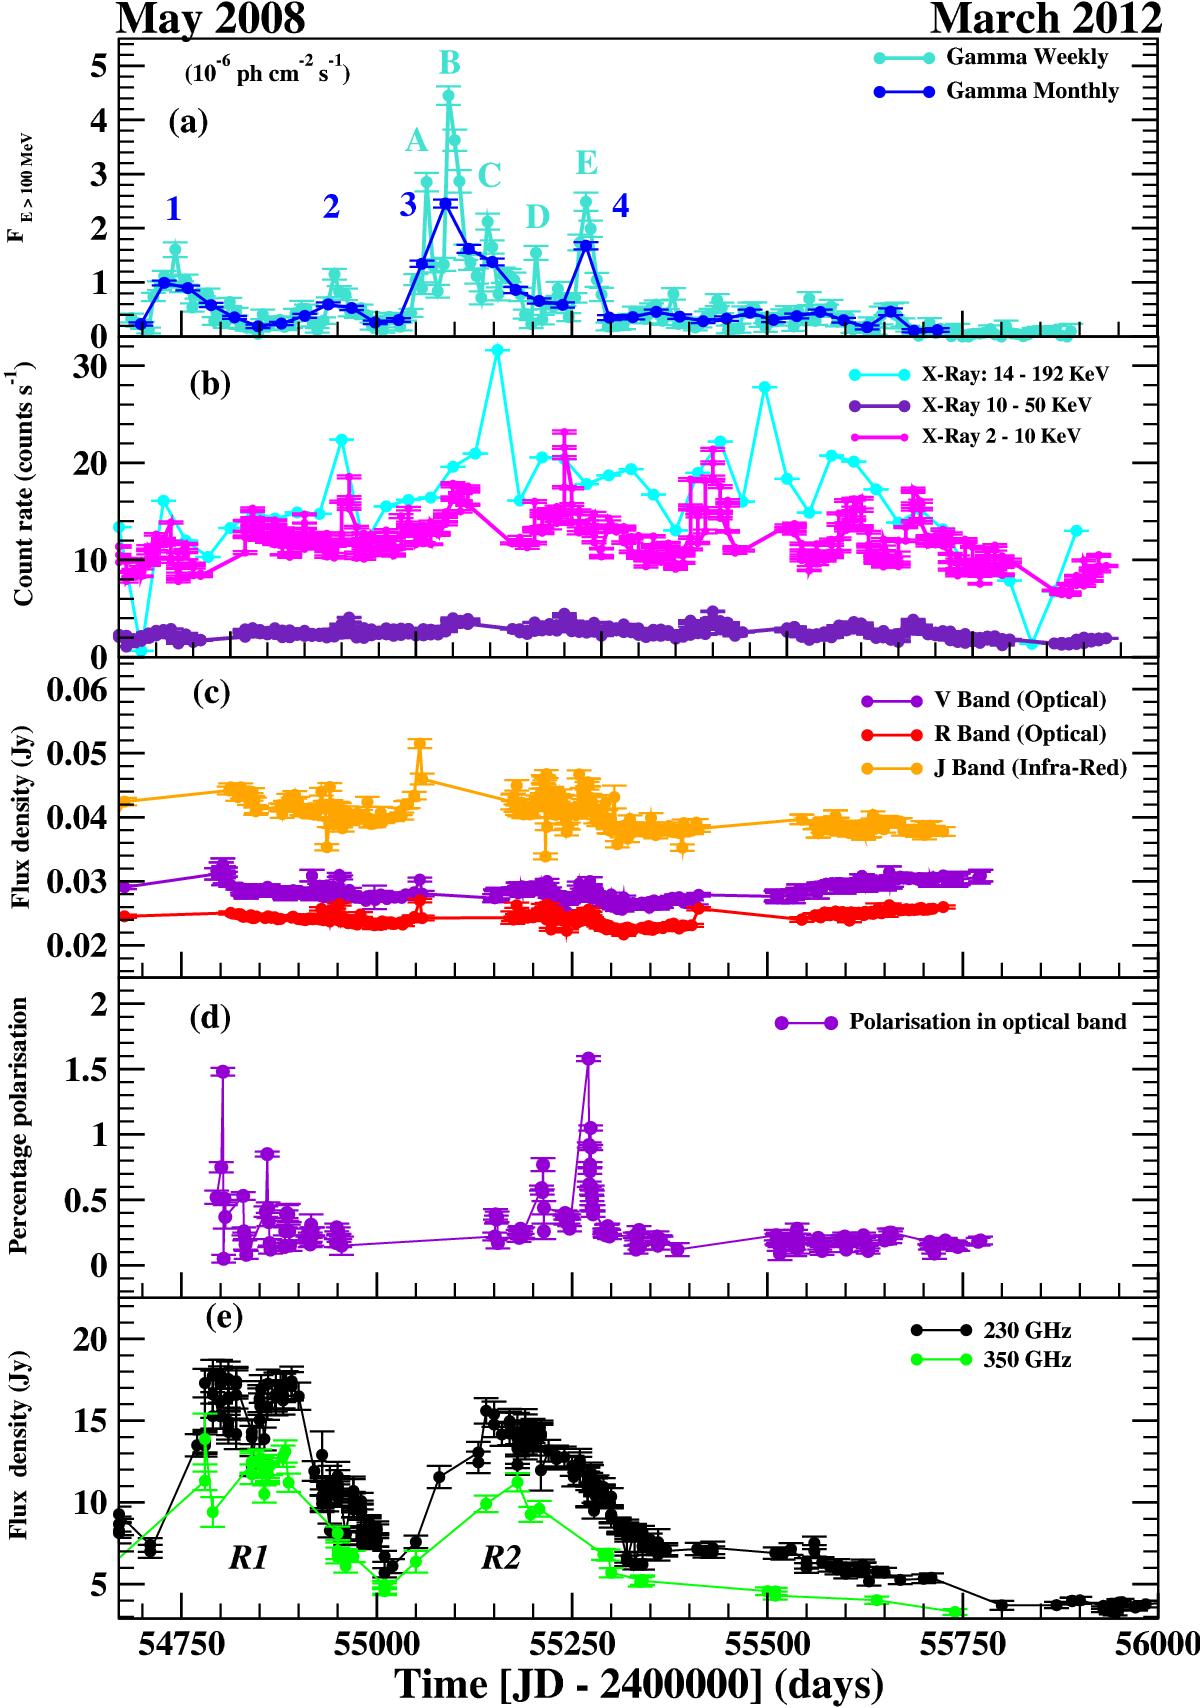
Broadband light curves of 3C 273: a) weekly (turquoise circles) and monthly (blue circles) averaged γ-ray light curves; b) 14–192 keV band (cyan), the 10–50 keV band (indigo) and the 2–10 keV band (magenta) X-ray light curves; c) optical (V and R passbands) and IR (J passband) light curves; d) optical percentage polarisation curve; and e) radio flux density curves at 230 GHz (in black) and 350 GHz (in green) bands.
Current usage metrics show cumulative count of Article Views (full-text article views including HTML views, PDF and ePub downloads, according to the available data) and Abstracts Views on Vision4Press platform.
Data correspond to usage on the plateform after 2015. The current usage metrics is available 48-96 hours after online publication and is updated daily on week days.
Initial download of the metrics may take a while.