Fig. 4
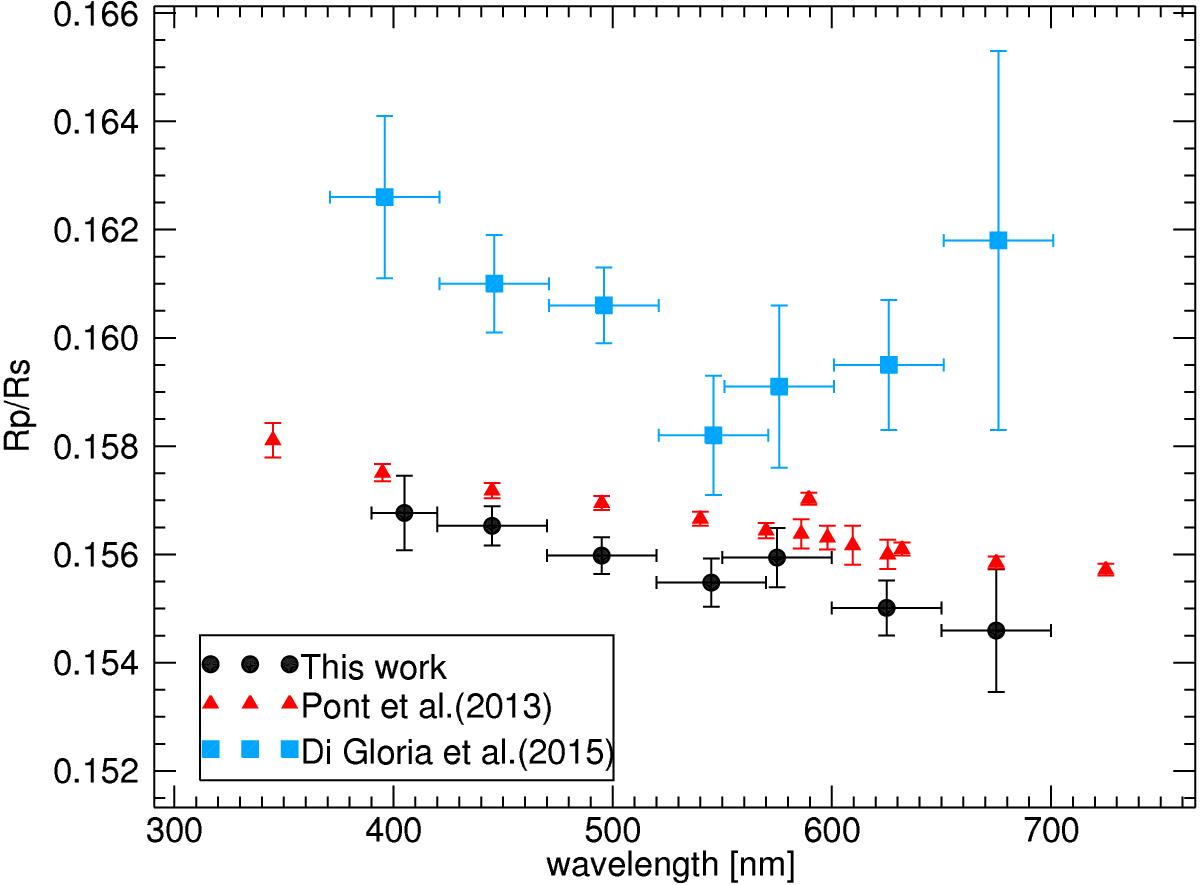
Broadband transmission spectrum of HD 189733b as calculated with this method (black circles). For comparison, red triangles are HST observations by Pont et al. (2013) and light blue squares are measurements from Di Gloria et al. (2015) using the chromatic RM effect on the same dataset of this paper. The vertical shift is due to the different transit parameters used in the different papers.
Current usage metrics show cumulative count of Article Views (full-text article views including HTML views, PDF and ePub downloads, according to the available data) and Abstracts Views on Vision4Press platform.
Data correspond to usage on the plateform after 2015. The current usage metrics is available 48-96 hours after online publication and is updated daily on week days.
Initial download of the metrics may take a while.