Free Access
Fig. 3
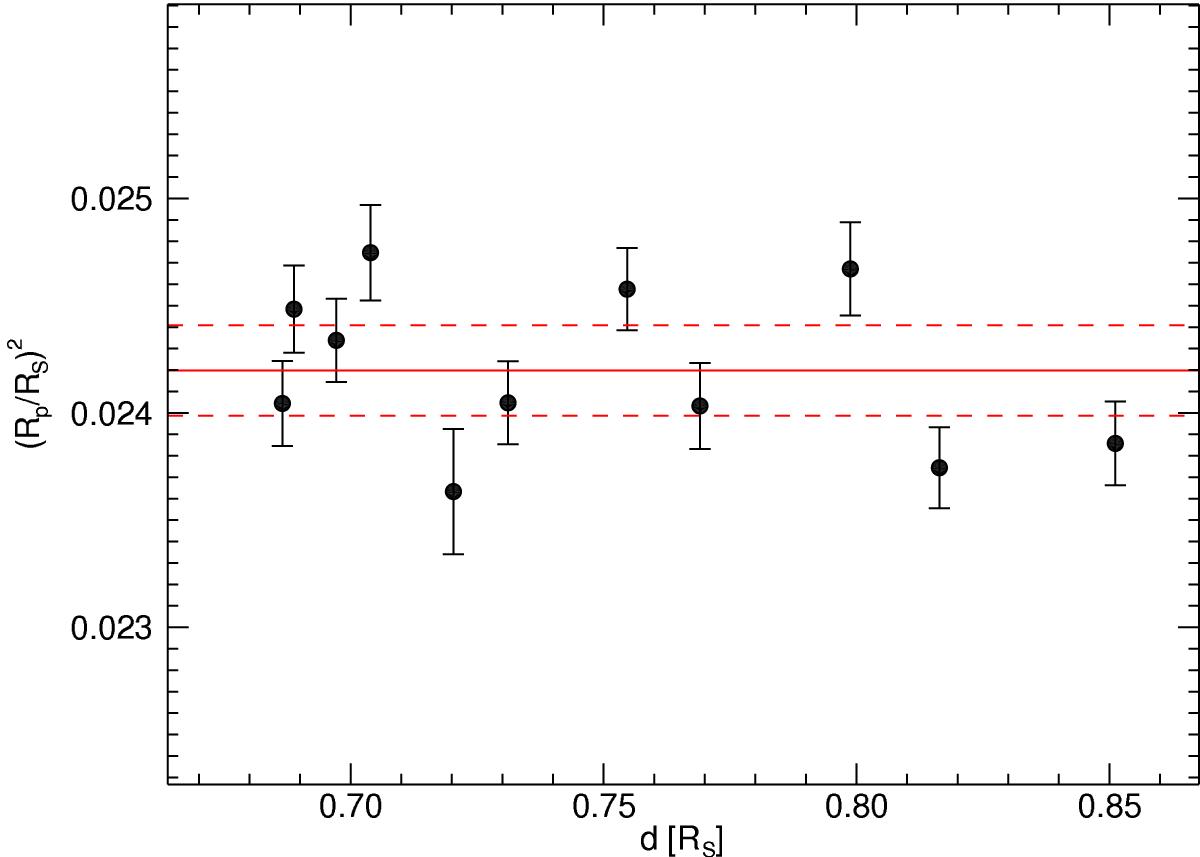
Example of the values of (Rp/Rs)2 found for one broadband as a function of the distance of the planet from the center of the star (d). The red line represents the average (Rp/Rs)2 taken as the final value; the dashed lines define its uncertainties.
Current usage metrics show cumulative count of Article Views (full-text article views including HTML views, PDF and ePub downloads, according to the available data) and Abstracts Views on Vision4Press platform.
Data correspond to usage on the plateform after 2015. The current usage metrics is available 48-96 hours after online publication and is updated daily on week days.
Initial download of the metrics may take a while.