Fig. 4
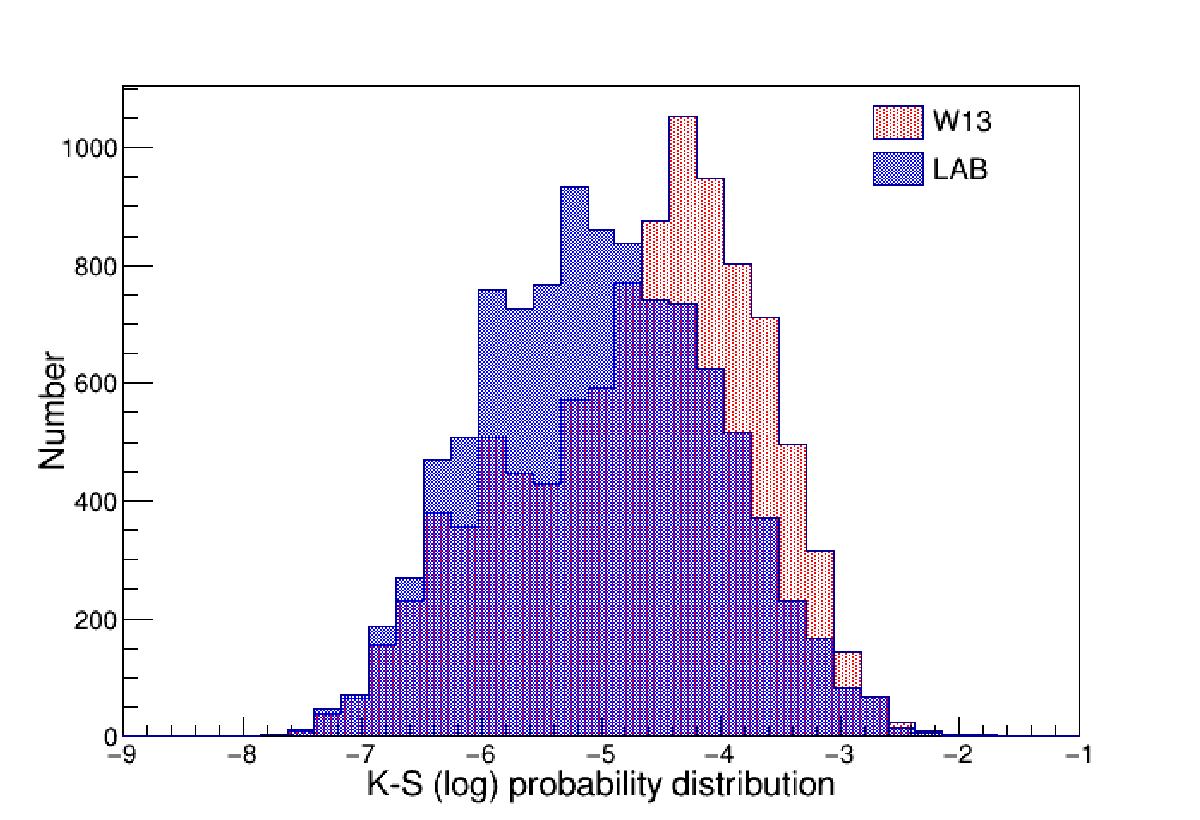
Kolmogorov-Smirnov (log) probability distributions. The dotted (red) histogram relates to the ![]() values (obtained with W13 Galactic model), while the thicker dotted (blue) histogram relates to the probability distribution of NH(z) values (obtained with the LAB survey). In both cases, it is evident that the probability of having the two subsamples descending from the same parent distribution is extremely low.
values (obtained with W13 Galactic model), while the thicker dotted (blue) histogram relates to the probability distribution of NH(z) values (obtained with the LAB survey). In both cases, it is evident that the probability of having the two subsamples descending from the same parent distribution is extremely low.
Current usage metrics show cumulative count of Article Views (full-text article views including HTML views, PDF and ePub downloads, according to the available data) and Abstracts Views on Vision4Press platform.
Data correspond to usage on the plateform after 2015. The current usage metrics is available 48-96 hours after online publication and is updated daily on week days.
Initial download of the metrics may take a while.