Fig. 3
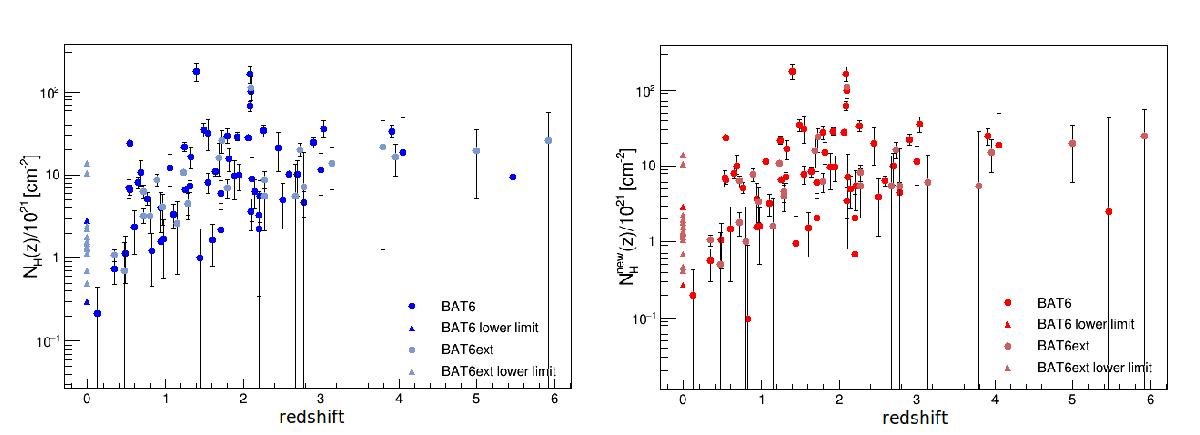
Intrinsic X-ray column density distribution as a function of redshift for both Galactic models. The panel on the left shows the NH(z) distribution obtained with the LAB survey. We note that the 41 GRBs of the extended sample, shown in a lighter colour with respect to the (blue) dots of the BAT6 sample, do not affect the increasing trend that came out in C12. The panel on the right reports the ![]() distribution, computed with the new W13 Galactic absorption model. The triangles, representing NH(z) for the 18 GRBs with no redshift measure, should be considered as lower limits, which increase with redshift as ~(1 + z)2.4. The error bars were calculated within XSPEC at 90% confidence level (Δχ2 = 2.71), as were the upper limits.
distribution, computed with the new W13 Galactic absorption model. The triangles, representing NH(z) for the 18 GRBs with no redshift measure, should be considered as lower limits, which increase with redshift as ~(1 + z)2.4. The error bars were calculated within XSPEC at 90% confidence level (Δχ2 = 2.71), as were the upper limits.
Current usage metrics show cumulative count of Article Views (full-text article views including HTML views, PDF and ePub downloads, according to the available data) and Abstracts Views on Vision4Press platform.
Data correspond to usage on the plateform after 2015. The current usage metrics is available 48-96 hours after online publication and is updated daily on week days.
Initial download of the metrics may take a while.