Free Access
Fig. 1
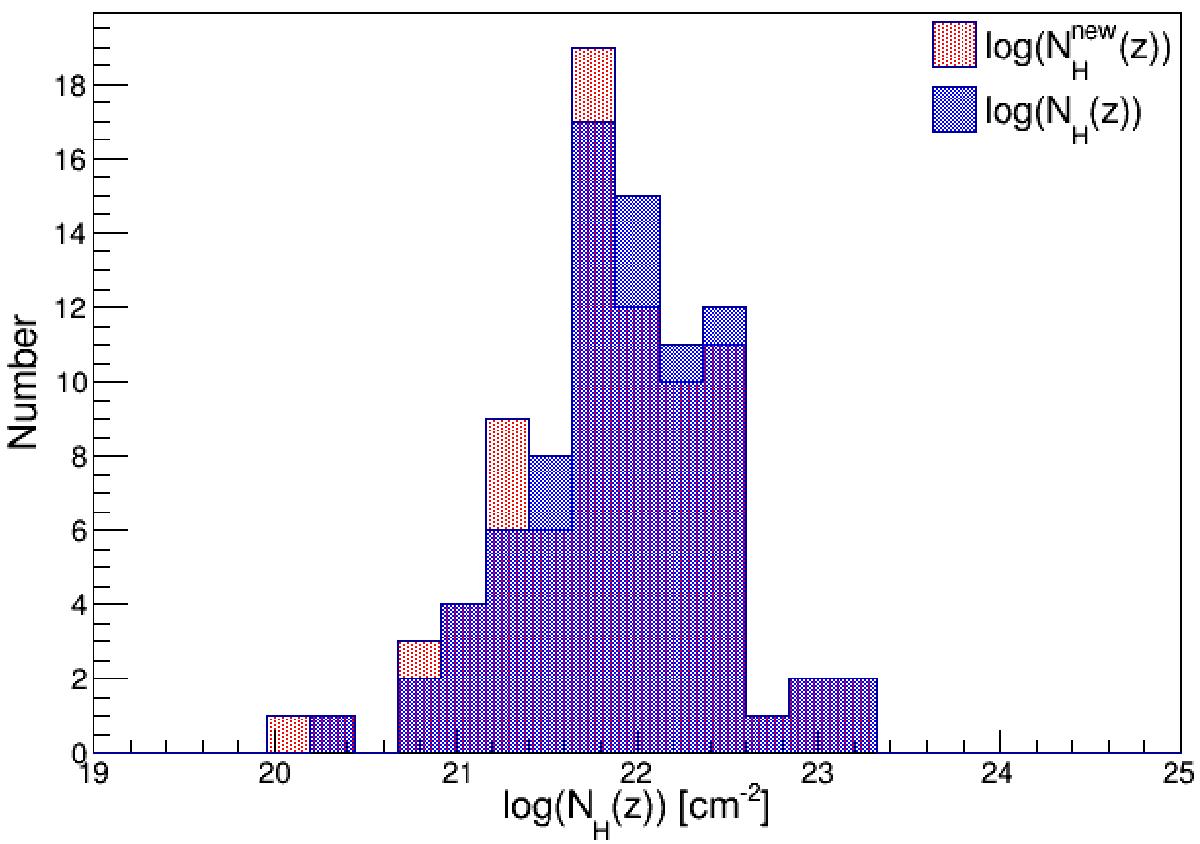
Intrinsic X-ray absorbing column density distributions of the BAT6ext sample. The dotted (red) histogram is related to the ![]() distribution, while the thicker dotted (blue) histogram shows the NH(z) distribution.
distribution, while the thicker dotted (blue) histogram shows the NH(z) distribution.
Current usage metrics show cumulative count of Article Views (full-text article views including HTML views, PDF and ePub downloads, according to the available data) and Abstracts Views on Vision4Press platform.
Data correspond to usage on the plateform after 2015. The current usage metrics is available 48-96 hours after online publication and is updated daily on week days.
Initial download of the metrics may take a while.