Fig. 1
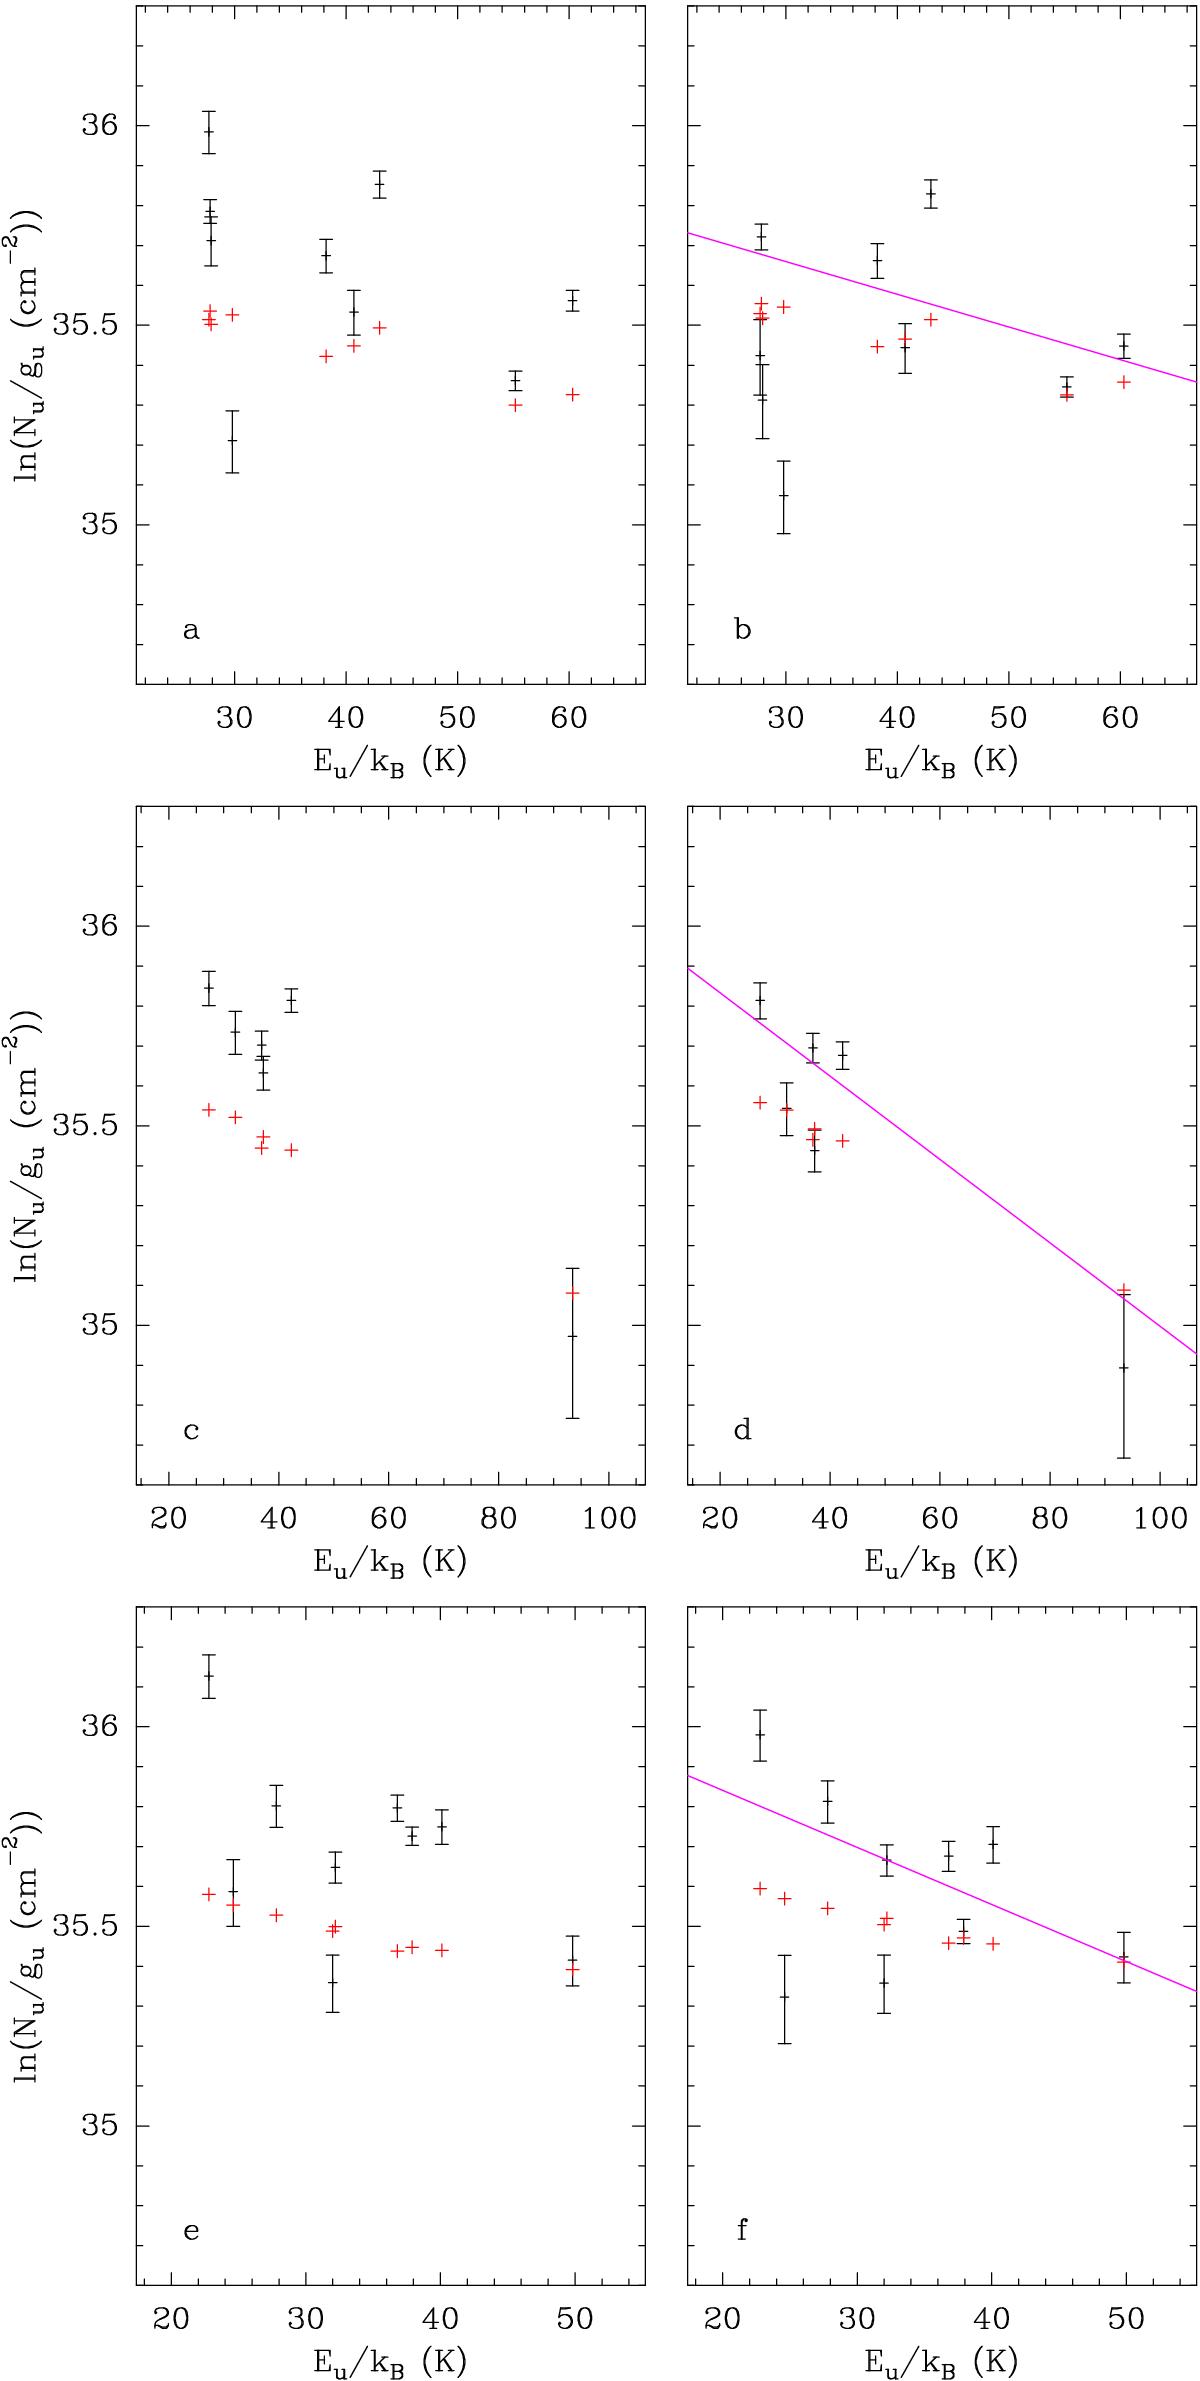
Panels a), b). Population diagram of CH![]() CN, ν= 0 toward Sgr B2(N2). Only the lines that are clearly detected and do not suffer too much from contamination from other species are shown. The observed data points are shown in black while the synthetic populations are shown in red. No correction is applied in panel a). In panel b), the optical depth correction was applied to both the observed and synthetic populations and the contamination from all other species included in the full model was removed from the observed data points. The purple line indicates a linear fit to the observed populations (in linear-logarithmic space). The derived rotation temperature is given in Table 7. Panels c), d): same as panels a), b) for
CN, ν= 0 toward Sgr B2(N2). Only the lines that are clearly detected and do not suffer too much from contamination from other species are shown. The observed data points are shown in black while the synthetic populations are shown in red. No correction is applied in panel a). In panel b), the optical depth correction was applied to both the observed and synthetic populations and the contamination from all other species included in the full model was removed from the observed data points. The purple line indicates a linear fit to the observed populations (in linear-logarithmic space). The derived rotation temperature is given in Table 7. Panels c), d): same as panels a), b) for ![]() CN, ν= 0. Panels e), f): same as panels a), b) for
CN, ν= 0. Panels e), f): same as panels a), b) for ![]() CN, ν= 0.
CN, ν= 0.
Current usage metrics show cumulative count of Article Views (full-text article views including HTML views, PDF and ePub downloads, according to the available data) and Abstracts Views on Vision4Press platform.
Data correspond to usage on the plateform after 2015. The current usage metrics is available 48-96 hours after online publication and is updated daily on week days.
Initial download of the metrics may take a while.