Fig. 12
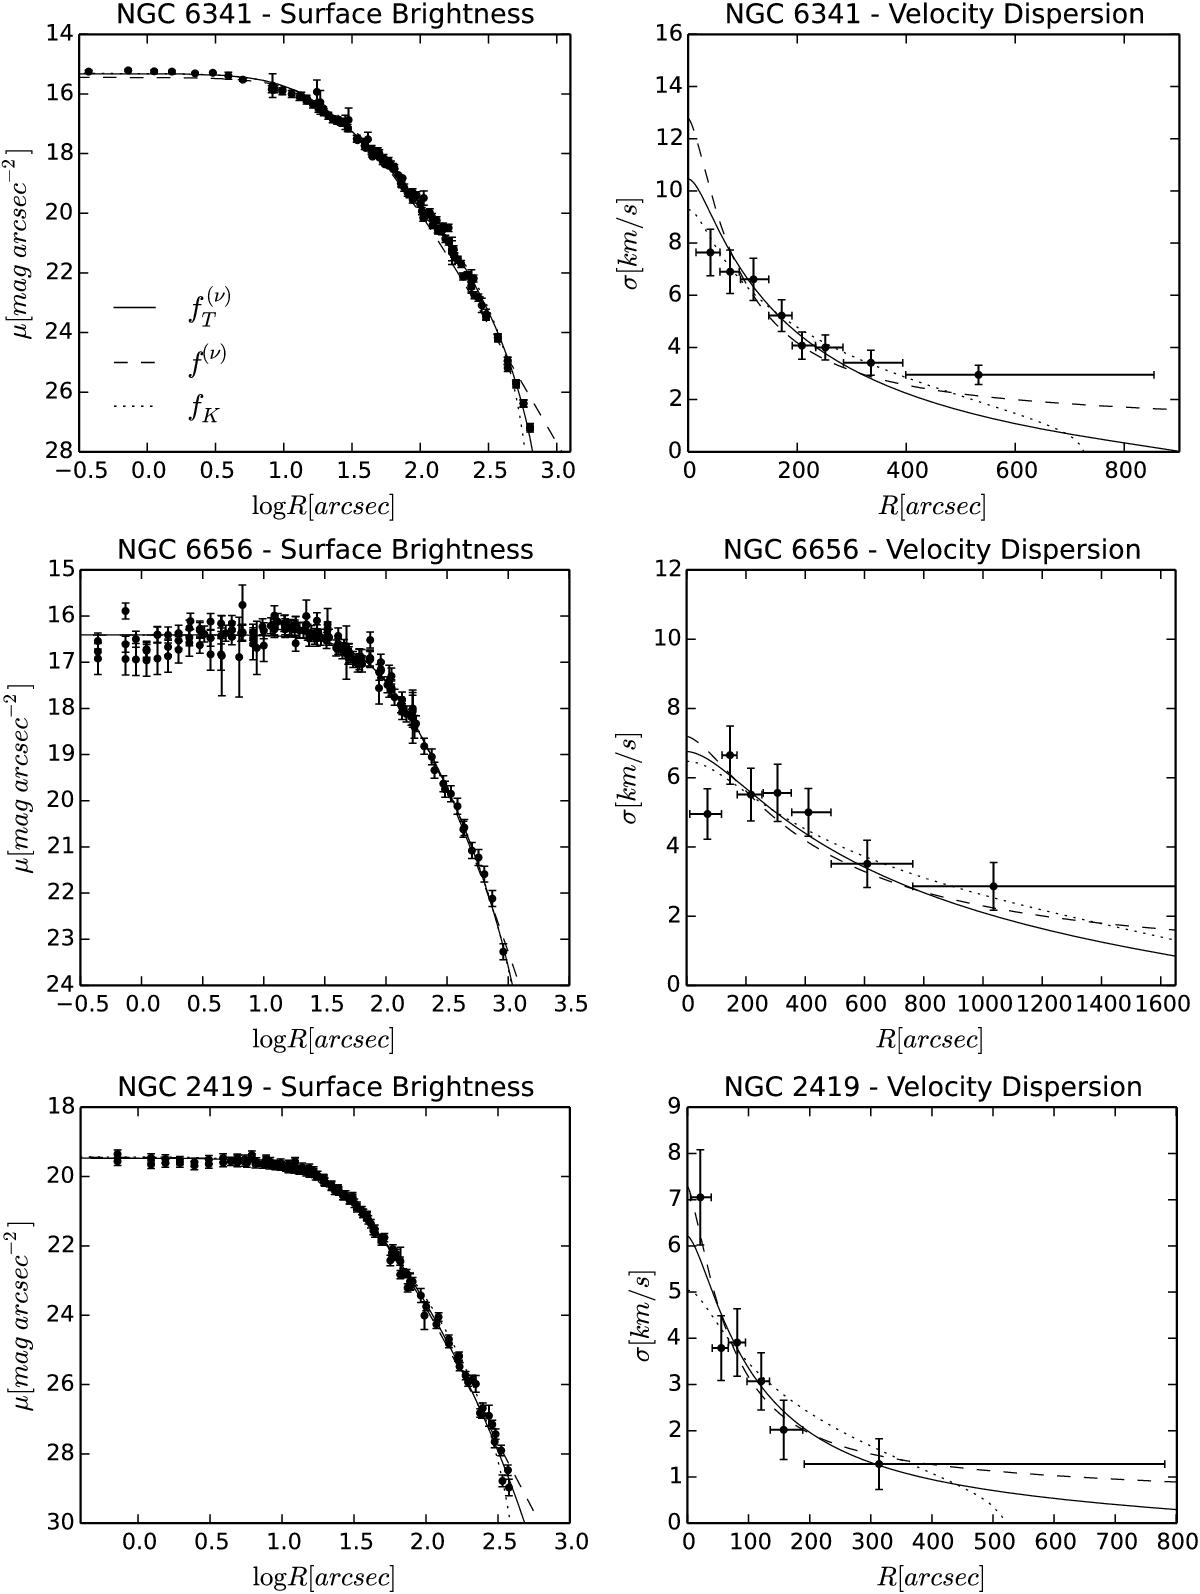
Photometric and kinematic fits for three globular clusters of the sample. Each
cluster is representative of its relaxation class as identified by the core
relaxation time Tc (for NGC 6341, log Tc ≈
7.96; for NGC 6656, log Tc ≈ 8.53; for NGC 2419
log Tc ≈
9.87). The curves represent the surface brightness profile
(left panels) and velocity dispersion profile (right
panels) calculated by means of dynamical models. In particular, dotted
lines correspond to King models; dashed lines to non-truncated f(ν) models, and
solid lines to ![]() models. In all panels, the dots are
the observed data. For each datapoint, errors are shown as vertical bars; in the
case of the velocity dispersion profile, the horizontal bars indicate the size ofthe
radial bin used to calculate each data point. The King profiles, f(ν) profiles, and
observed data are taken from ZBV12.
models. In all panels, the dots are
the observed data. For each datapoint, errors are shown as vertical bars; in the
case of the velocity dispersion profile, the horizontal bars indicate the size ofthe
radial bin used to calculate each data point. The King profiles, f(ν) profiles, and
observed data are taken from ZBV12.
Current usage metrics show cumulative count of Article Views (full-text article views including HTML views, PDF and ePub downloads, according to the available data) and Abstracts Views on Vision4Press platform.
Data correspond to usage on the plateform after 2015. The current usage metrics is available 48-96 hours after online publication and is updated daily on week days.
Initial download of the metrics may take a while.