Free Access
Fig. 4
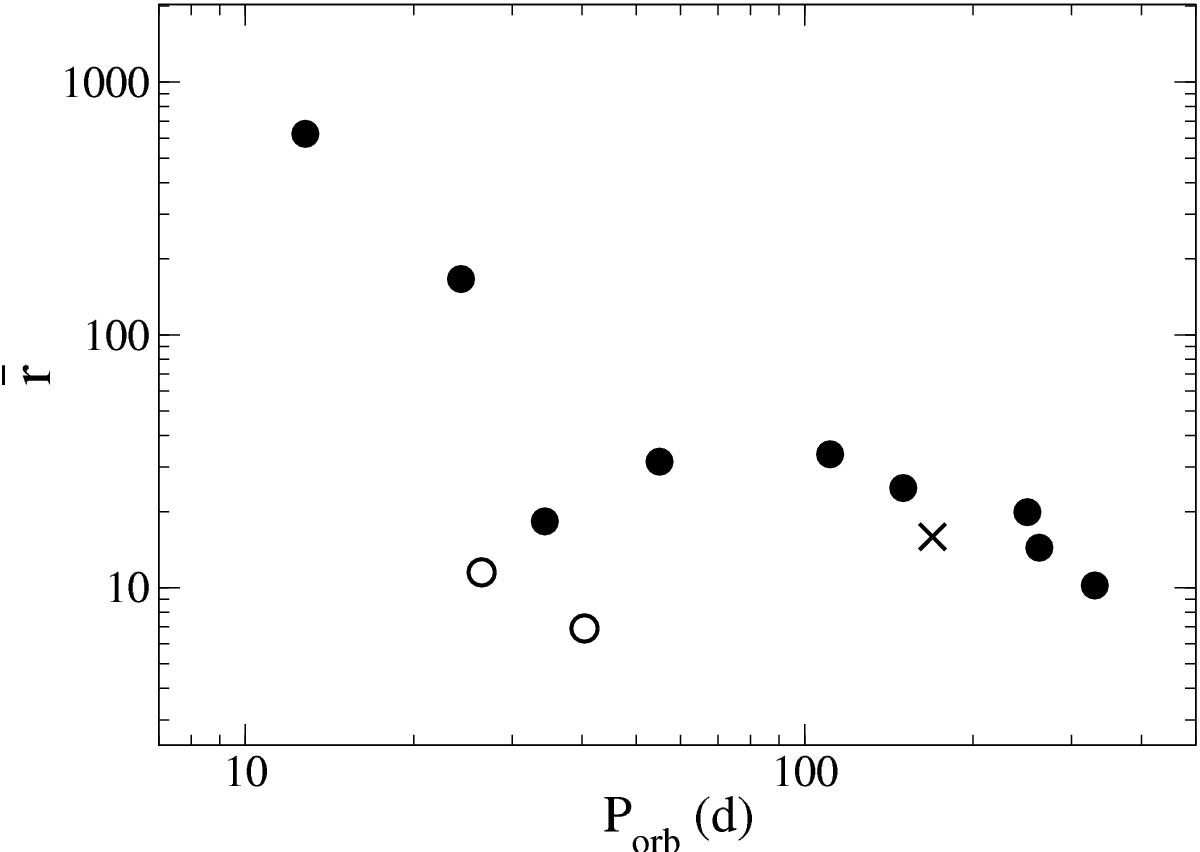
Hα equivalent width variability as a function of the orbital period in BeXBs with orbital solutions. The Y-axis is the average ratio of the standard deviation over the mean calculated in intervals of 500 days (or 1000 days for XTE J1946+274, cross). Empty circles correspond to peculiar systems (see text).
Current usage metrics show cumulative count of Article Views (full-text article views including HTML views, PDF and ePub downloads, according to the available data) and Abstracts Views on Vision4Press platform.
Data correspond to usage on the plateform after 2015. The current usage metrics is available 48-96 hours after online publication and is updated daily on week days.
Initial download of the metrics may take a while.