Fig. 2
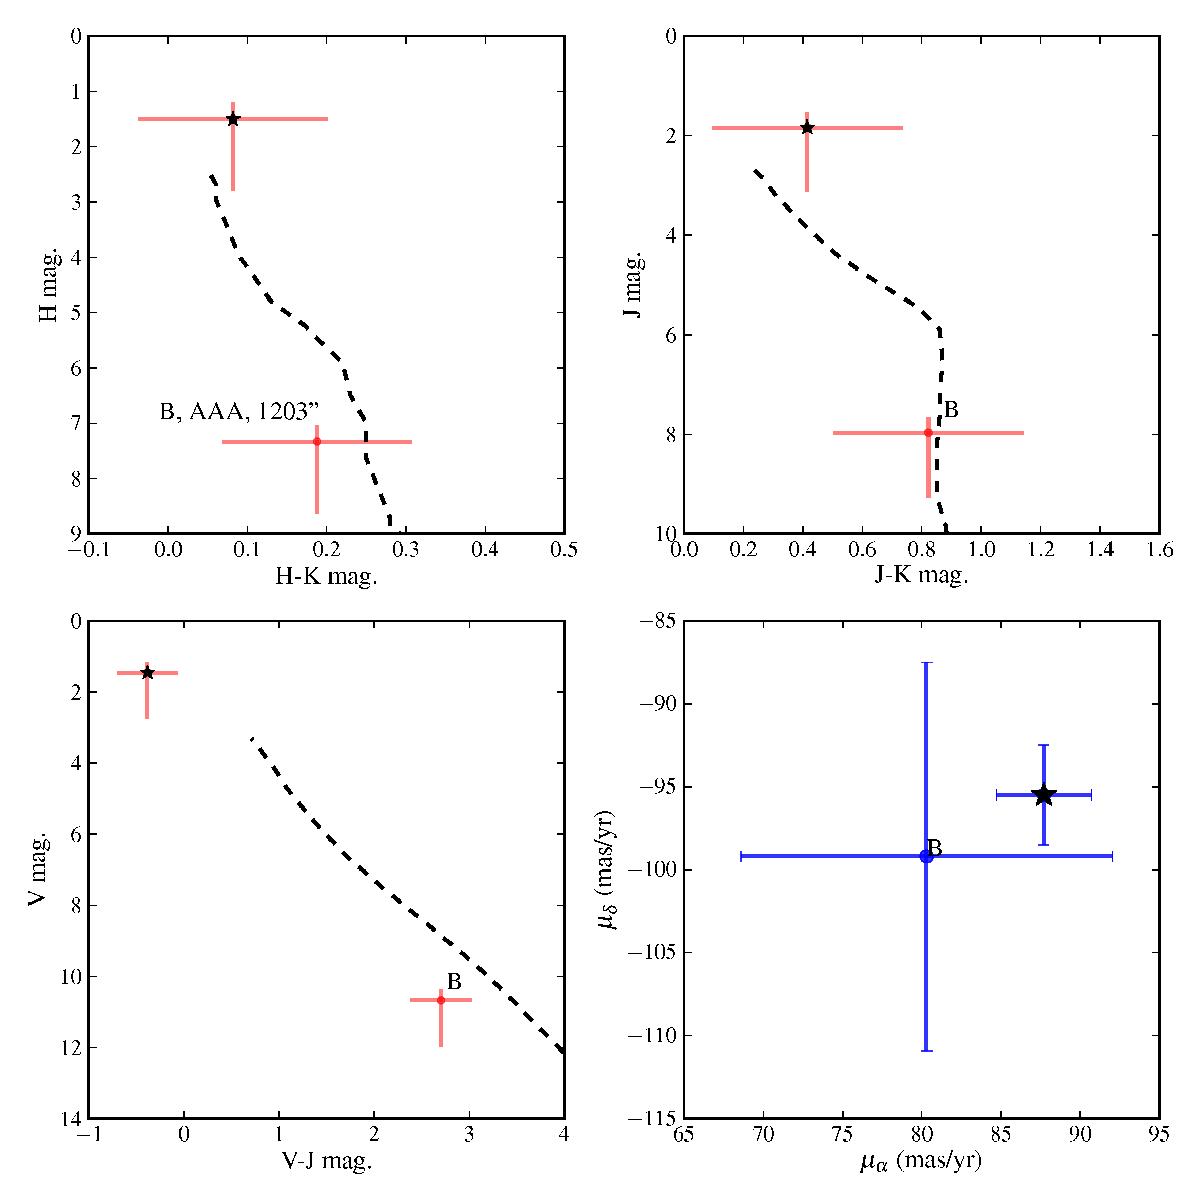
Top left, top right, and bottom left panels: colour−magnitude diagrams for Kap Psc+2MASS J23270114+0055200 in (H − K, K), (J − K, K), and (V − J, V), respectively. The text next to the marker indicates the component designation, the quality flags of the 2MASS photometry and angular separation from the primary. The dotted lines are the evolutionary tracks of Baraffe et al. (2015) using the age of the moving group. Bottom right panel: proper motion values of the primary and companion.
Current usage metrics show cumulative count of Article Views (full-text article views including HTML views, PDF and ePub downloads, according to the available data) and Abstracts Views on Vision4Press platform.
Data correspond to usage on the plateform after 2015. The current usage metrics is available 48-96 hours after online publication and is updated daily on week days.
Initial download of the metrics may take a while.