Fig. 11
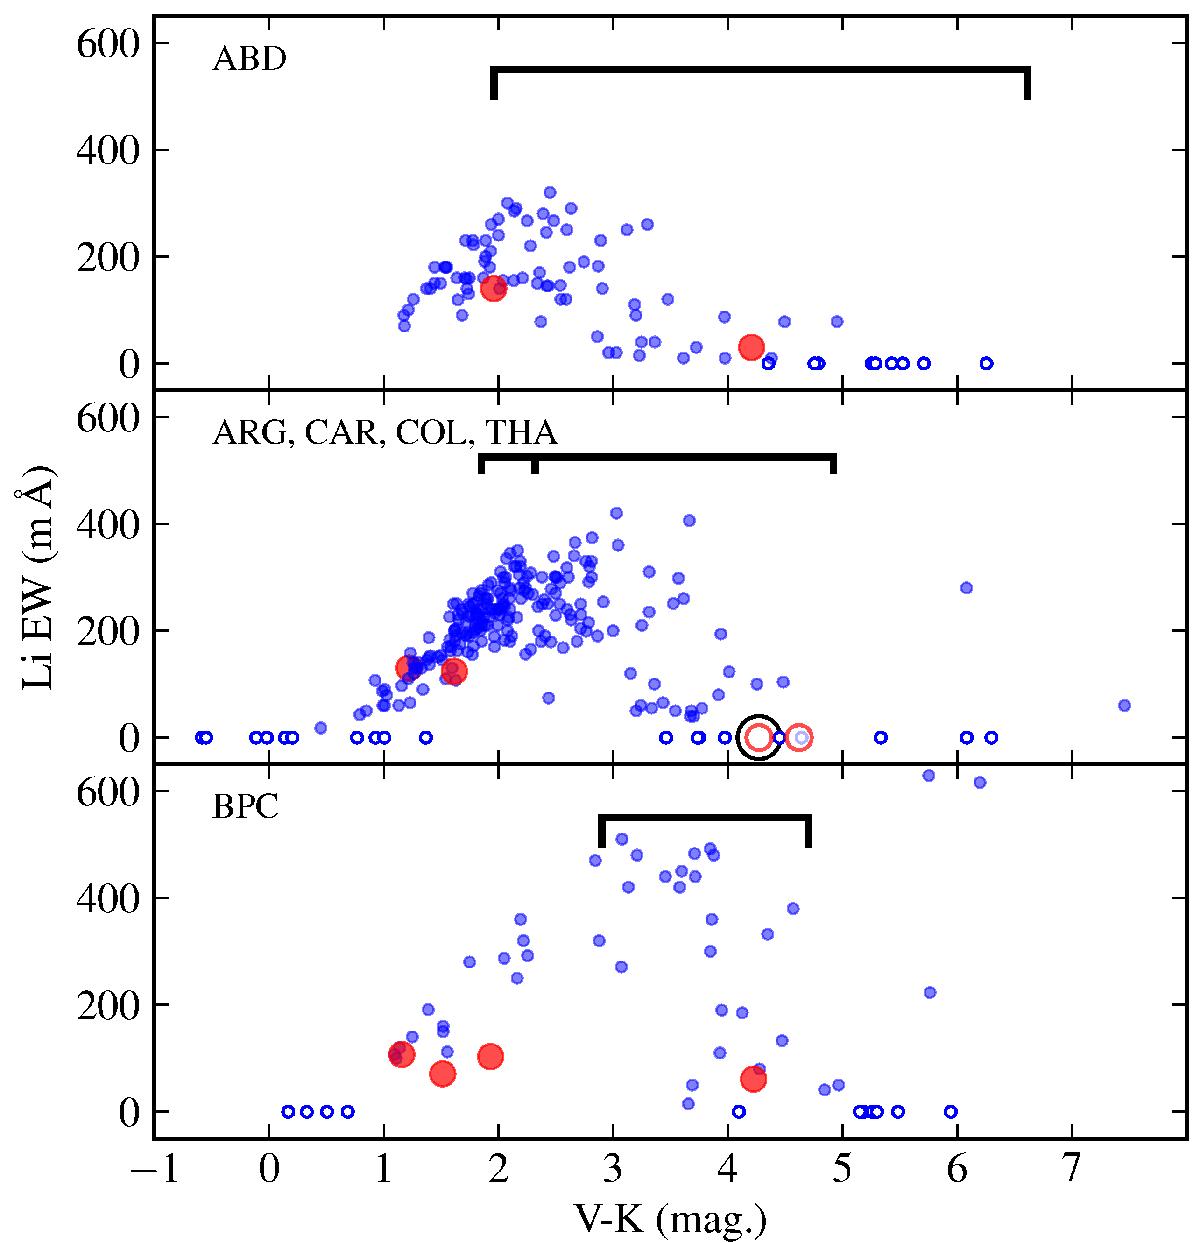
V − K magnitude versus Li EW for original sample (blue) and targets identified in this work (red). Filled and open markers represent detections and non-detections, respectively. Black open circles represent sources classified as non-members (“N”) in Table 4. The black lines encompass regions of lithium depletion (Li/Li0 ≤ 0.1) using the models of Baraffe et al. (2015). In the middle panel there are two minima corresponding to ages of 30 and 40 Myr.
Current usage metrics show cumulative count of Article Views (full-text article views including HTML views, PDF and ePub downloads, according to the available data) and Abstracts Views on Vision4Press platform.
Data correspond to usage on the plateform after 2015. The current usage metrics is available 48-96 hours after online publication and is updated daily on week days.
Initial download of the metrics may take a while.