Fig. 6
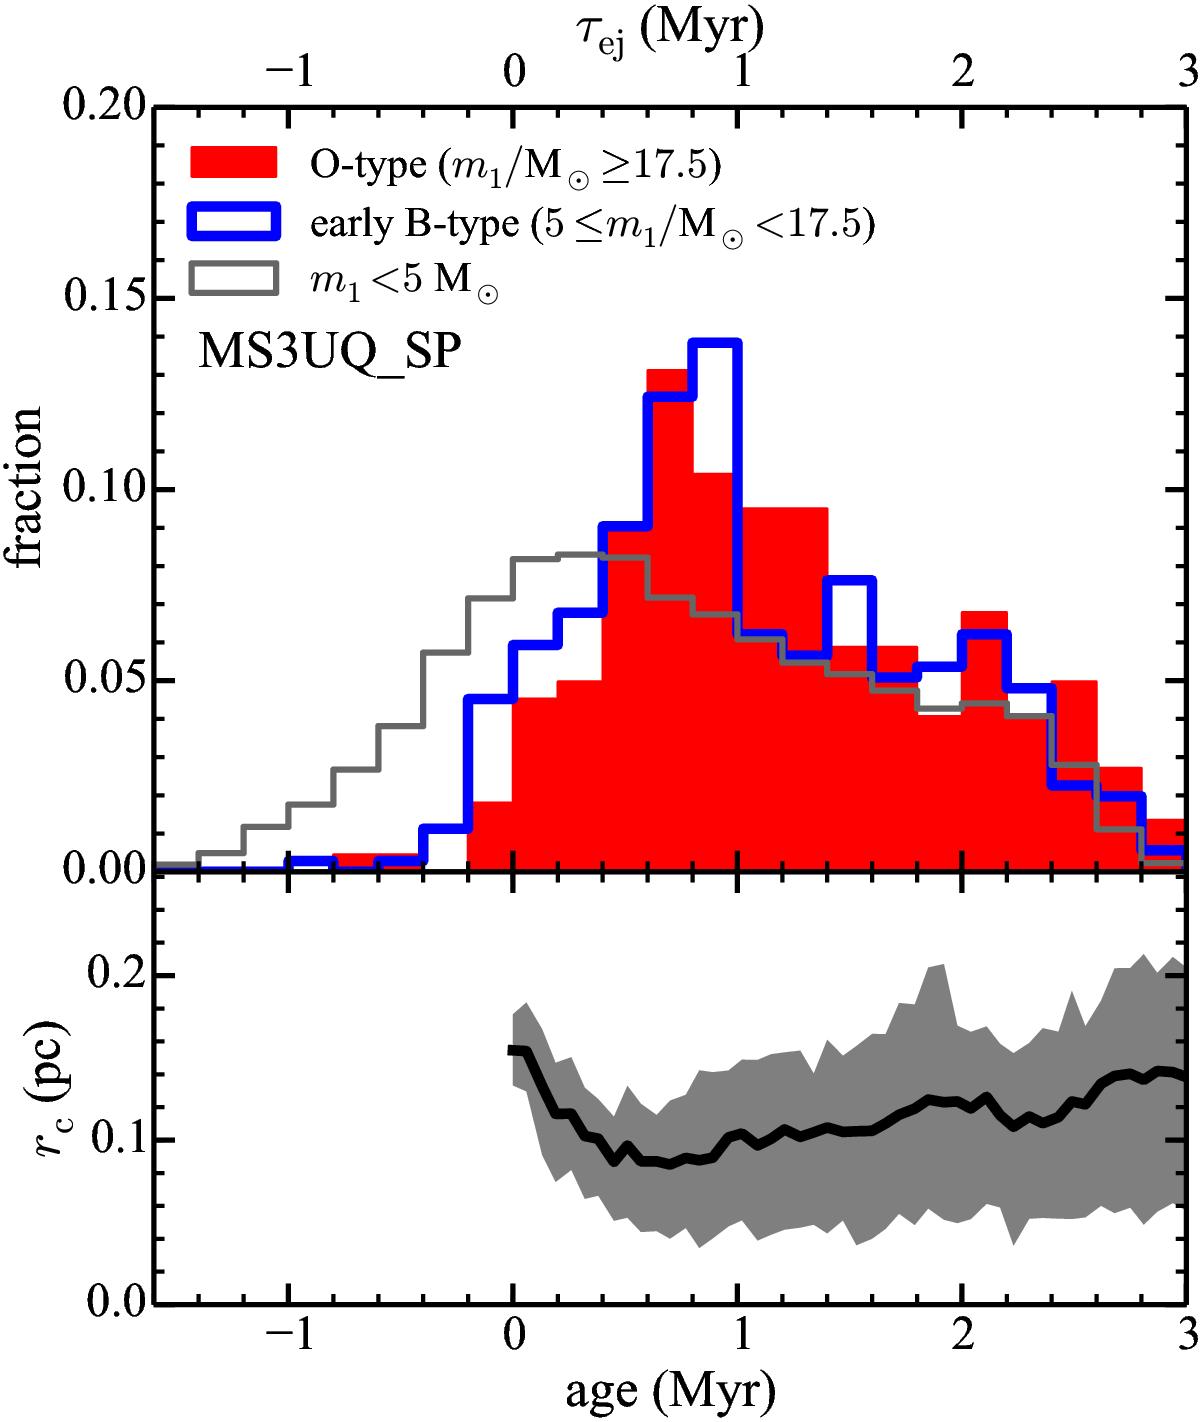
Top: distribution of estimated ages of the cluster when the massive systems are ejected from the cluster, τej, for three different (primary star) mass groups in the MS3UQ_SP model. All ejected systems from 100 runs for each model are counted. Bottom: averaged core radius, rc, of the same model as a function of time (black line). The lower and upper boundary of the grey shaded area are the 17th and 84th percentile, i.e., 68% of clusters have a core radius ranging within the area. The secondary maximum is shown in the top panel near 2.1 Myr when the core radius shrinks again as a result of the Spitzer instability.
Current usage metrics show cumulative count of Article Views (full-text article views including HTML views, PDF and ePub downloads, according to the available data) and Abstracts Views on Vision4Press platform.
Data correspond to usage on the plateform after 2015. The current usage metrics is available 48-96 hours after online publication and is updated daily on week days.
Initial download of the metrics may take a while.