Free Access
Fig. 5
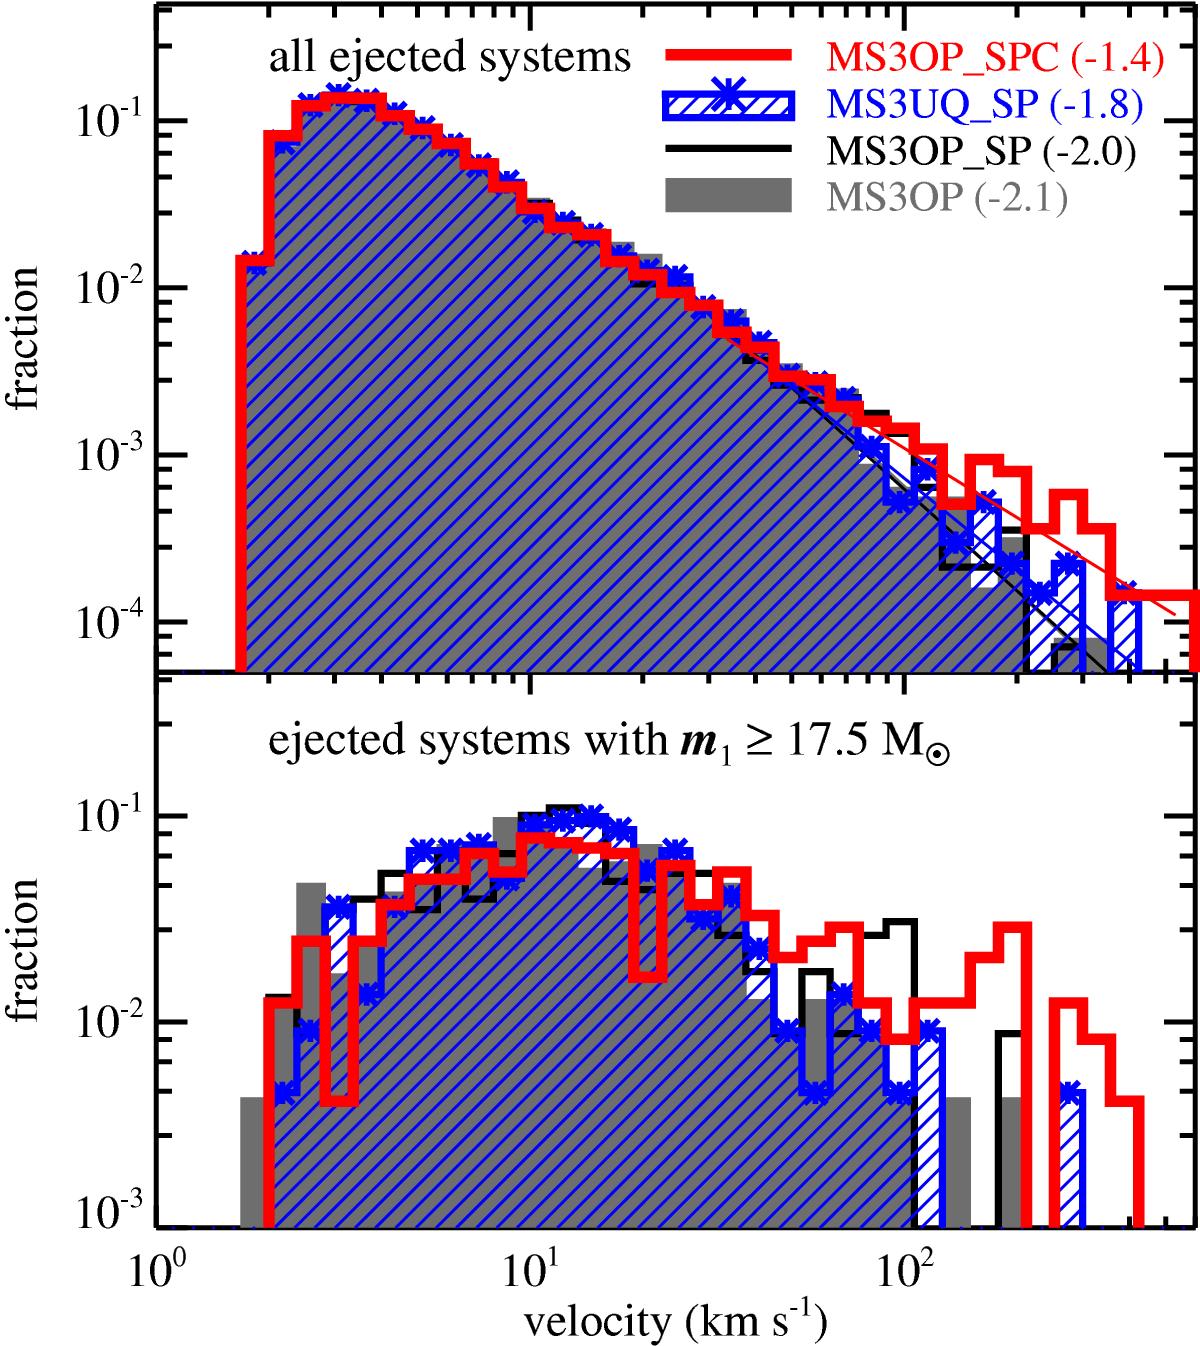
Velocity distributions of the all ejected systems (top panel) and of the ejected O-star systems (bottom panel) in four models, MS3OP_SPC, MS3UQ_SP, MS3OP_SP, and MS3OP. The solid lines in the upper panel are a linear fit for the systems with a velocity ≥ 30 km s-1.
Current usage metrics show cumulative count of Article Views (full-text article views including HTML views, PDF and ePub downloads, according to the available data) and Abstracts Views on Vision4Press platform.
Data correspond to usage on the plateform after 2015. The current usage metrics is available 48-96 hours after online publication and is updated daily on week days.
Initial download of the metrics may take a while.