Fig. 4
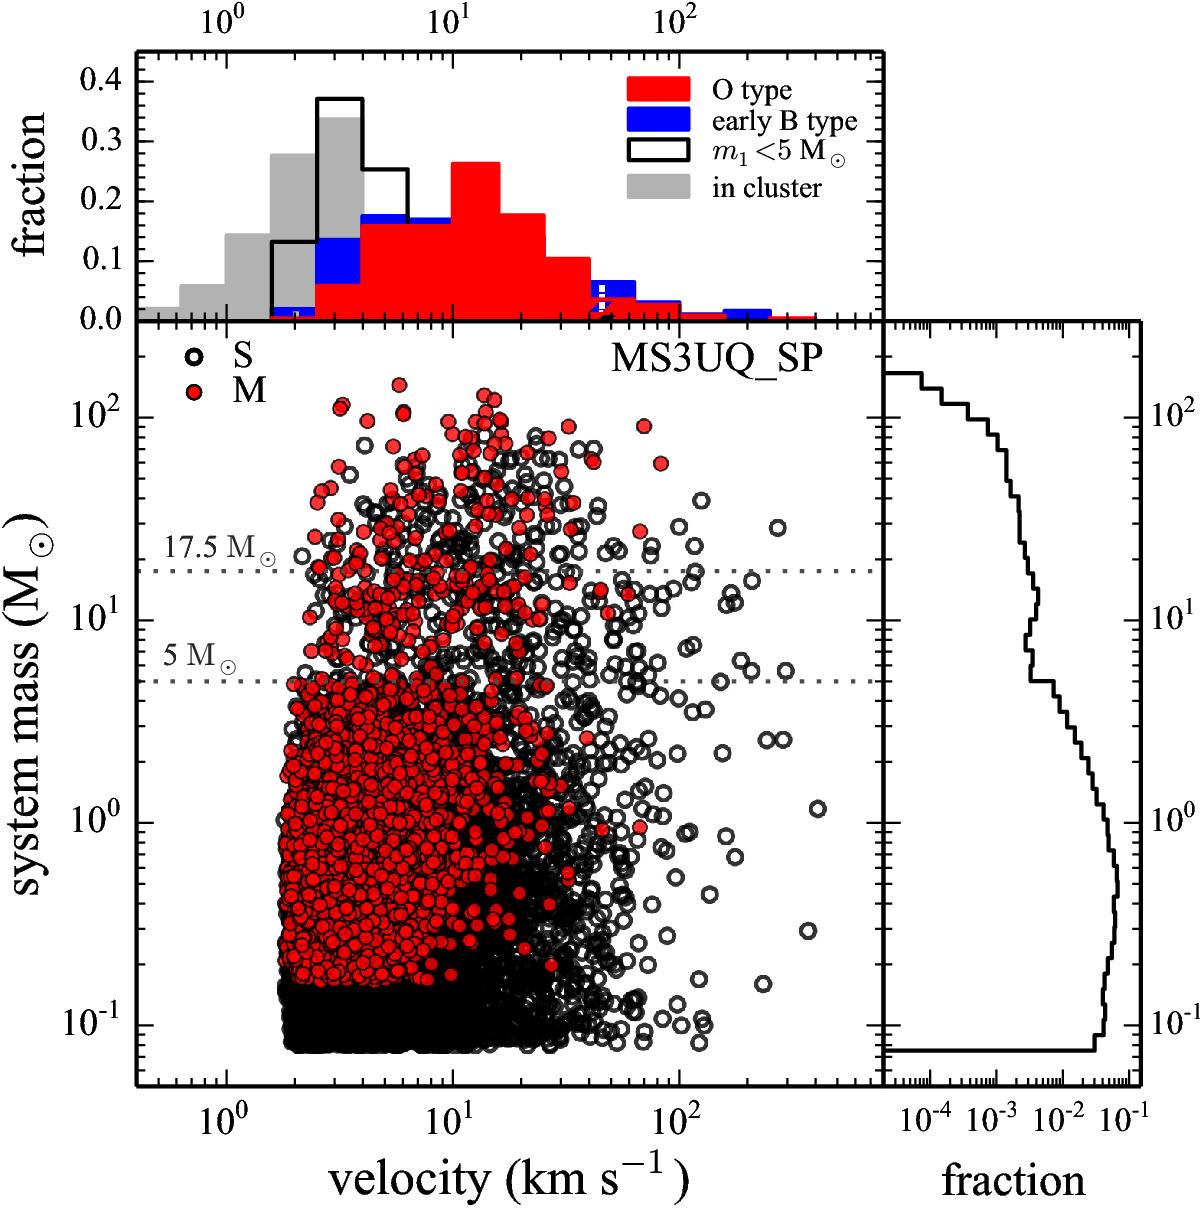
System mass versus velocity of all escapees from the most realistic model (MS3UQ_SP) of our models. Filled red and open black circles are multiple systems and single stars, respectively. The top panel presents the histograms of velocities of ejected systems for three different (primary) mass groups and all systems that remain in the clusters. The lower right panel is the histogram of the system mass for all ejected systems.
Current usage metrics show cumulative count of Article Views (full-text article views including HTML views, PDF and ePub downloads, according to the available data) and Abstracts Views on Vision4Press platform.
Data correspond to usage on the plateform after 2015. The current usage metrics is available 48-96 hours after online publication and is updated daily on week days.
Initial download of the metrics may take a while.