Fig. 16
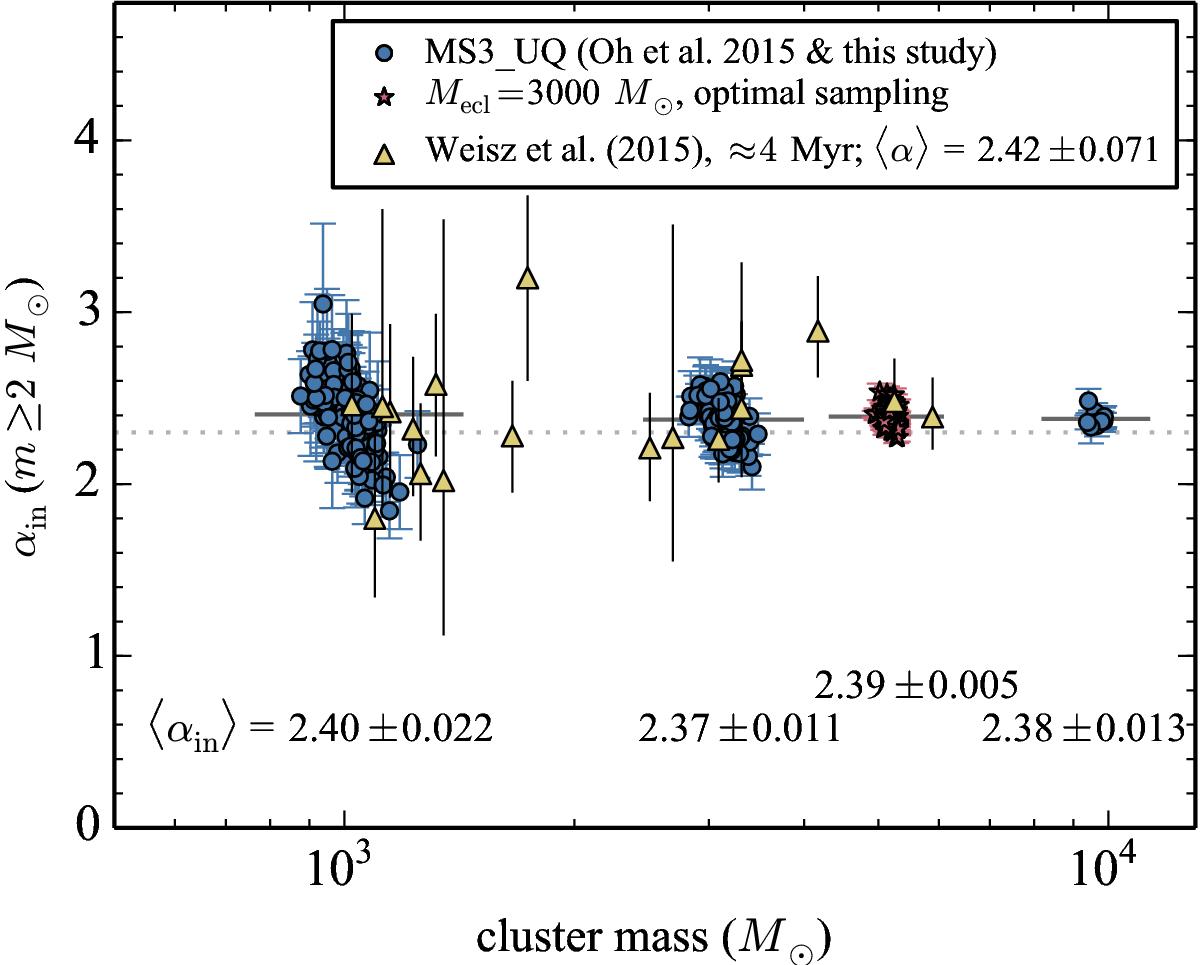
Present-day MFs of all stars ≥ 2 M⊙ for clusters with Mecl = 103, 103.5, and 104 M⊙ at 3 Myr. Grey horizontal bars and numbers below the points are the average values for each N-body model with different cluster mass. The uncertainties on the average ⟨ αin ⟩ values are standard deviations of the mean. The red star is the model with Mecl = 3000 M⊙ and with initial conditions similar to the MS3UQ_SP model, but stellar masses derived by optimal sampling (see text). For this model, cluster masses are shifted to higher masses by 0.25 on the logarithmic scale to separate the model from the MS3UQ_SP model. The triangles are clusters with an age of ≈ 4 Myr in M 31 from Weisz et al. (2015).
Current usage metrics show cumulative count of Article Views (full-text article views including HTML views, PDF and ePub downloads, according to the available data) and Abstracts Views on Vision4Press platform.
Data correspond to usage on the plateform after 2015. The current usage metrics is available 48-96 hours after online publication and is updated daily on week days.
Initial download of the metrics may take a while.