Fig. 12
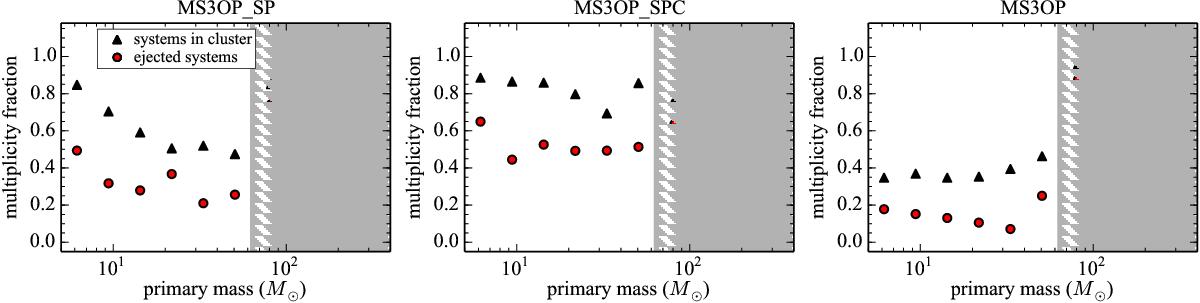
Averaged multiplicity fraction as a function of primary mass of systems for primary mass ≥ 5 M⊙ from three models (MS3OP_SP, MS3OP_SPC, and MS3OP). Black triangles and red circles are the multiplicity fractions of systems that remain in the cluster and of the dynamically ejected systems, respectively. Model names are indicated at the top of subfigures. Grey hatched area indicates where a primary mass is higher than 62.4 M⊙, that is, the evolved mass of a mmax star (79.2 M⊙ at t = 0 Myr) at 3 Myr, evolved by single stellar evolution. Primary stars of all systems inside the area are therefore stellar mergers. Technically, these stars are blue stragglers that lie above the main sequence (cf. Dalessandro et al. 2013).
Current usage metrics show cumulative count of Article Views (full-text article views including HTML views, PDF and ePub downloads, according to the available data) and Abstracts Views on Vision4Press platform.
Data correspond to usage on the plateform after 2015. The current usage metrics is available 48-96 hours after online publication and is updated daily on week days.
Initial download of the metrics may take a while.