Fig. 9
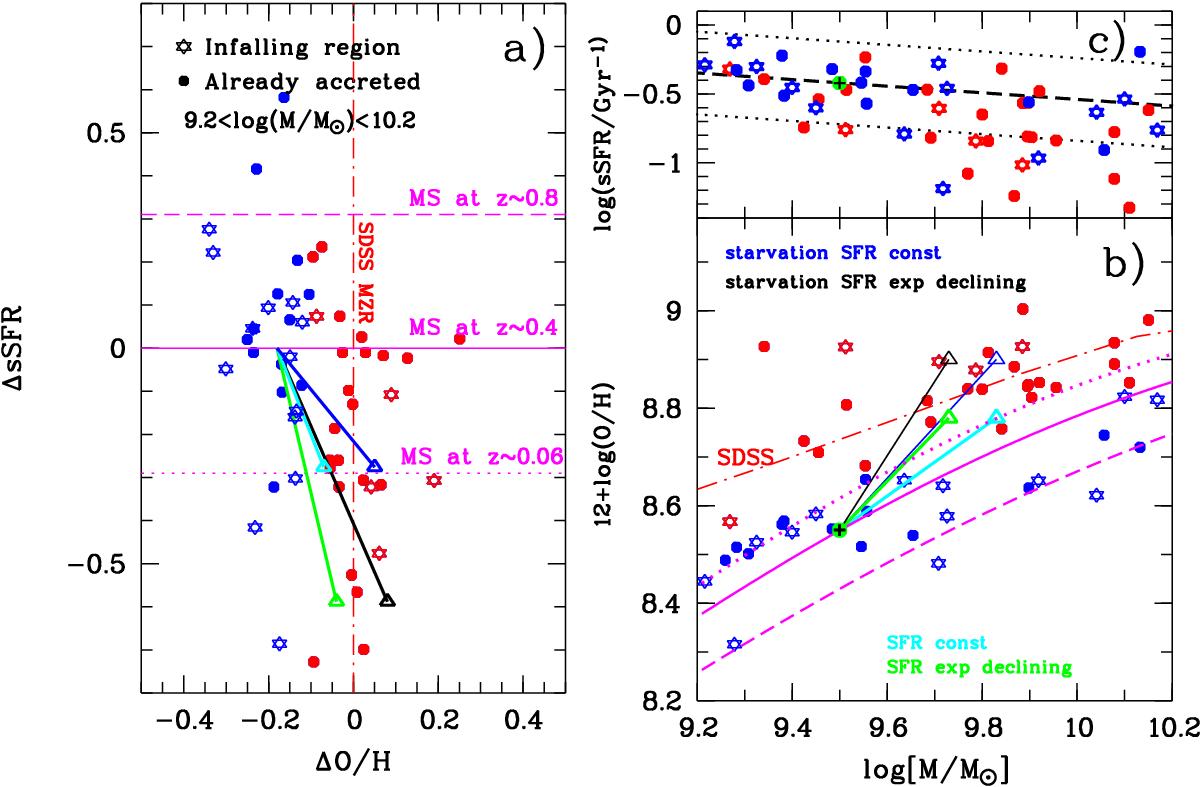
Panel a): offsets ΔO/H to the local MZR vs. ΔsSFR to the MS at z ~ 0.4 for cluster galaxies with masses 9.2 < log (M/M⊙) < 10.2 (Mmed). Filled circles (stars) indicate accreted (infalling) galaxies based on their position in the phase-space diagram (Fig. 7). Galaxies with O/Hs consistent with the local MZR are shown in red, other objects in blue. The MS mean values at z ~ 0.8, z ~ 0.4, and z ~ 0.06, based on the equation of the evolution of the sSFR from Peng et al. (2010a), are indicated by dashed, solid, and dotted magenta lines. The dash-dotted red line indicates the median local MZR of our matched SDSS sample (see also Fig. 5). Four tracks of a model galaxy start with 1.2 M⊙/yr and log (M/M⊙) = 9.5. The model galaxy continues forming stars for 3 Gyr with a constant SFR (cyan track) or exponentially declining SFR with a τ = 3 Gyr (green track), and the corresponding tracks are shown for a strangulation scenario with constant SFR (blue track) and exponentially declining SFR (black track). Panel b): MZR for Mmed cluster galaxies with data symbols and paths of model galaxies color-coded as in panel a). The magenta lines show the Li13 expectations of the Z(M,SFR) for galaxies on the MS at different redshifts, with dashed, solid, and dotted lines corresponding to different z like the magenta lines in the panel a). Panel c): the mass-sSFR relation for cluster galaxies color-coded in red for O/Hs consistent with the local MZR. Dashed and dotted lines show the median and dispersion of the mass-sSFR relation according to Peng et al. (2010a). The green filled circles with a black cross in panels b) and c) indicate the starting point of the toy models described in Sect. 5.2: log (Mstart/M⊙) = 9.5, SFRstart = 1.2 M⊙/ yr, and Zstart = 8.55. For the sake of visibility we do not plot error bars in Fig. 9; however, the error bars were already shown in the respective mass-sSFR (Fig. 3) and MZR plot (Fig. 5) for galaxies of all stellar masses.
Current usage metrics show cumulative count of Article Views (full-text article views including HTML views, PDF and ePub downloads, according to the available data) and Abstracts Views on Vision4Press platform.
Data correspond to usage on the plateform after 2015. The current usage metrics is available 48-96 hours after online publication and is updated daily on week days.
Initial download of the metrics may take a while.