Fig. 2
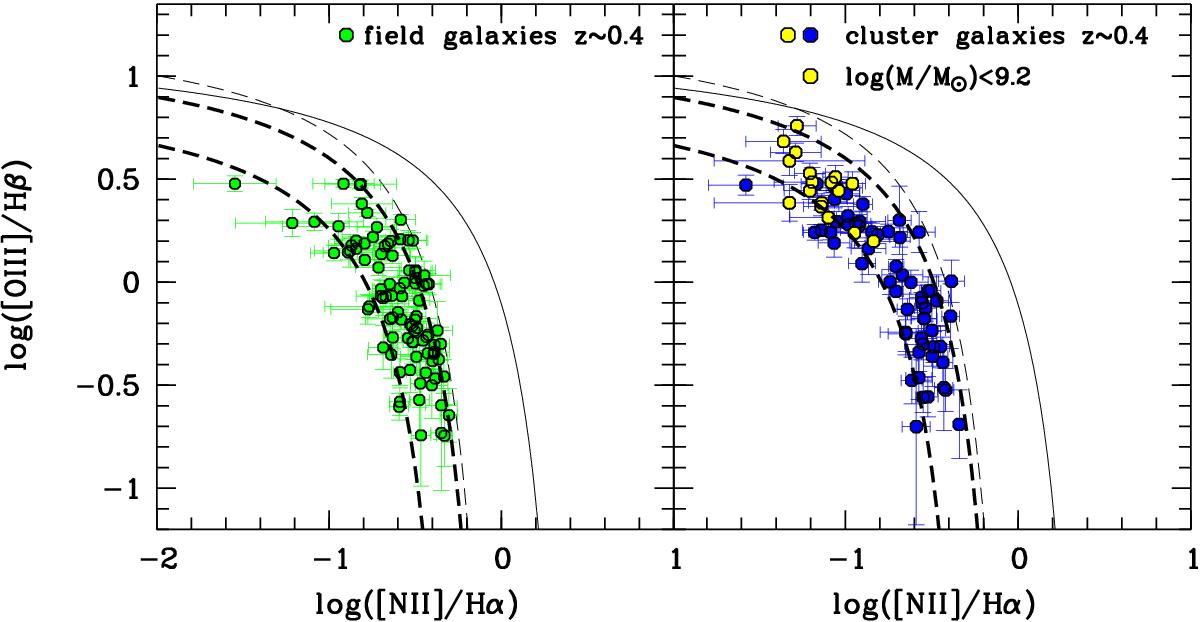
BPT (Baldwin et al. 1981) diagnostic diagram used to distinguish star formation-dominated galaxies from AGNs. The left diagram shows the field galaxies at z ~ 0.4, and the right panel the Zgals cluster members of MAC0416 (cluster galaxies of similar high masses to the field comparison sample are depicted in blue). Both the field and cluster galaxies at z ~ 0.4 lie under and to the left of the theoretical curve (solid) of Kewley et al. (2001) and of the empirical curve (thin dashed) of Kauffmann et al. (2003a), which separate star-forming galaxies (below and left of the curves) from AGNs (above and right of the curves), indicating that in all of them the dominant source of ionization in the gas is recent star formation. Most galaxies lie on the star-forming metallicity sequence with rough boundaries indicated by the thick dashed lines.
Current usage metrics show cumulative count of Article Views (full-text article views including HTML views, PDF and ePub downloads, according to the available data) and Abstracts Views on Vision4Press platform.
Data correspond to usage on the plateform after 2015. The current usage metrics is available 48-96 hours after online publication and is updated daily on week days.
Initial download of the metrics may take a while.