Fig. 9
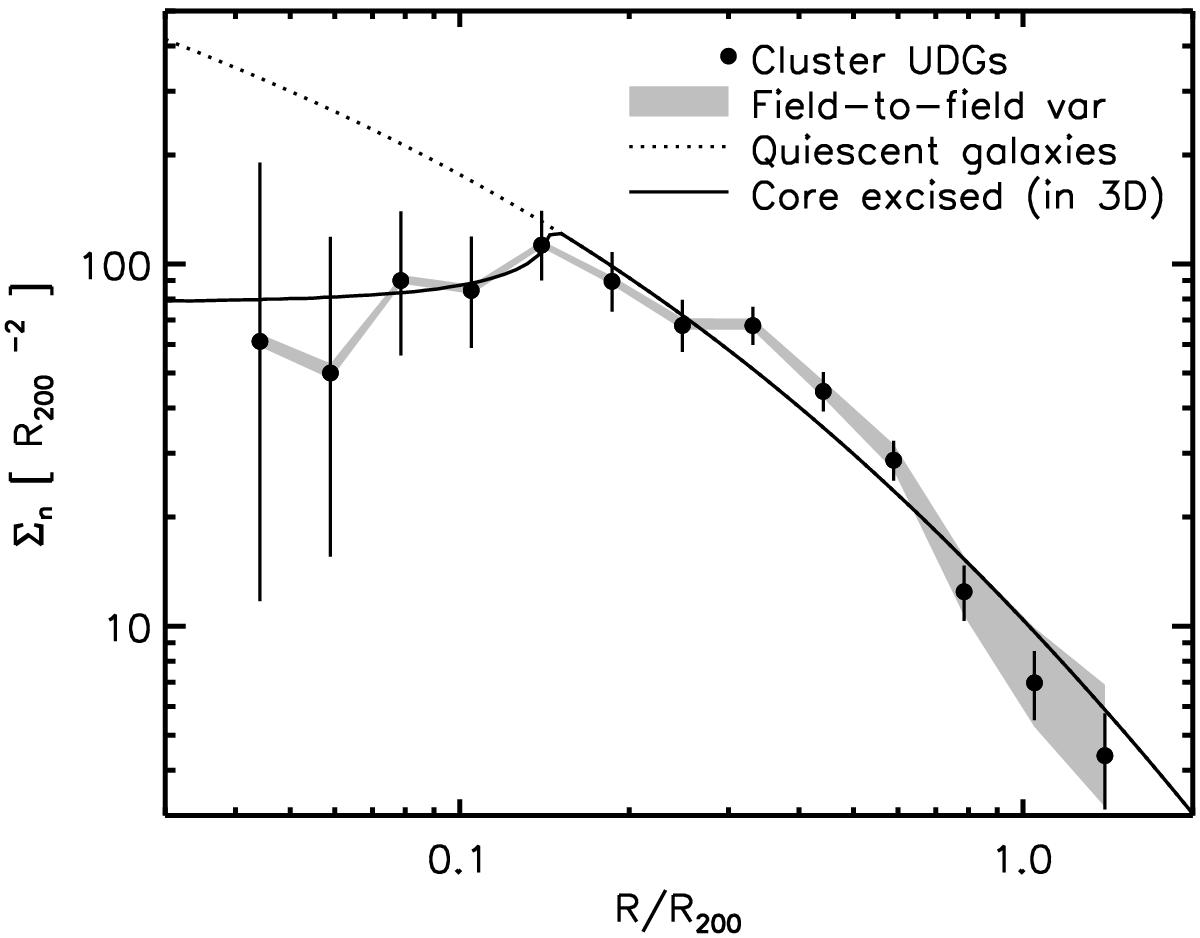
Black points with statistical errors: background-subtracted and completeness- corrected UDGs in the ensemble cluster (as in Fig. 8). Grey area: the systematic error due to field-to-field variance in the reference background fields. Dotted curve: best-fit projected generalized NFW profile to the stellar mass distribution of the total population of quiescent galaxies in the clusters (vdB15), rescaled in normalisation. Black curve: same but with an excised core of 0.15 × R200 (before projection).
Current usage metrics show cumulative count of Article Views (full-text article views including HTML views, PDF and ePub downloads, according to the available data) and Abstracts Views on Vision4Press platform.
Data correspond to usage on the plateform after 2015. The current usage metrics is available 48-96 hours after online publication and is updated daily on week days.
Initial download of the metrics may take a while.