Fig. 8
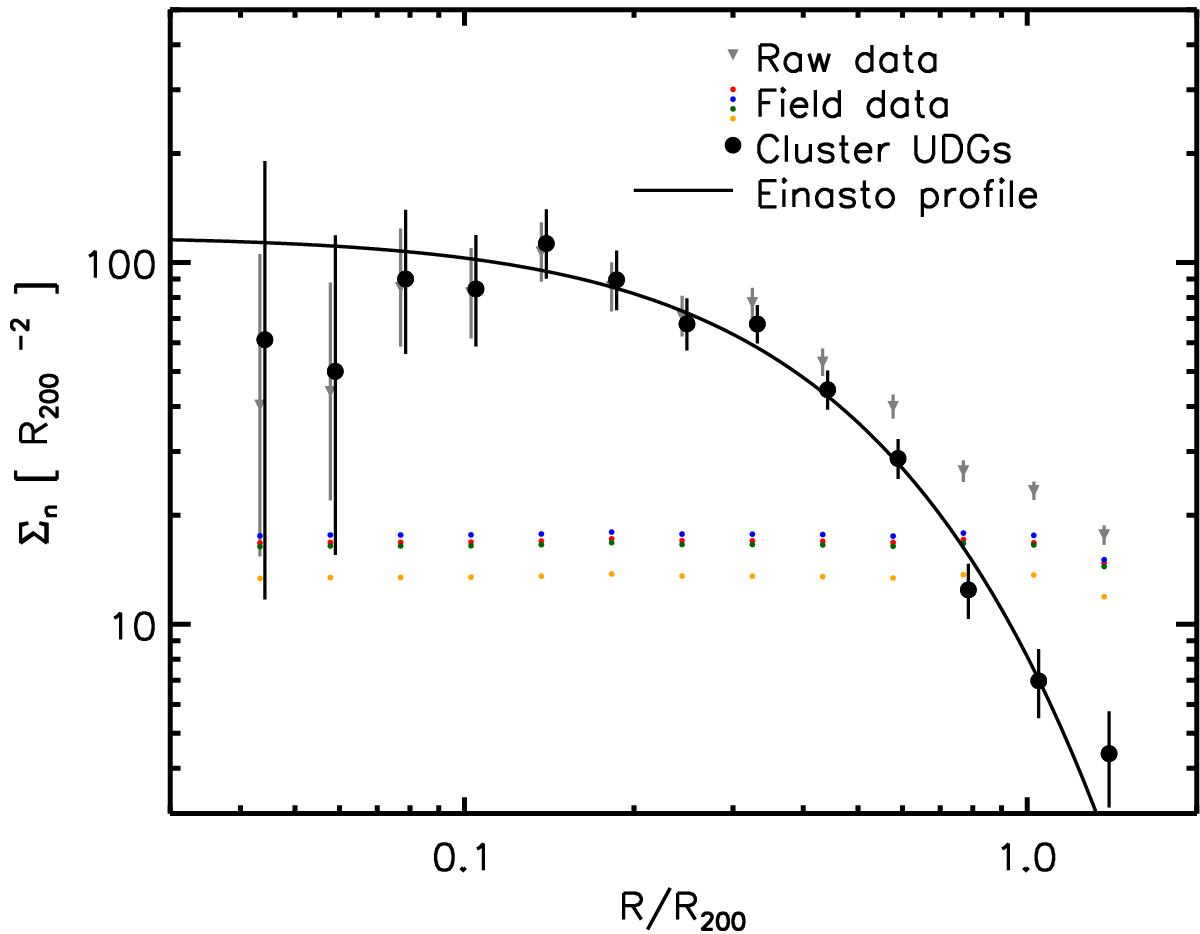
Small grey triangles: radial number density distribution of the selected sample of UDGs for the ensemble cluster field. Four colours: reference depth-matched CFHTLS fields. Large black symbols: background-subtracted and completeness-corrected UDGs in the ensemble cluster. Solid curve: best-fit projected Einasto profile to the cluster data.
Current usage metrics show cumulative count of Article Views (full-text article views including HTML views, PDF and ePub downloads, according to the available data) and Abstracts Views on Vision4Press platform.
Data correspond to usage on the plateform after 2015. The current usage metrics is available 48-96 hours after online publication and is updated daily on week days.
Initial download of the metrics may take a while.