Fig. 4
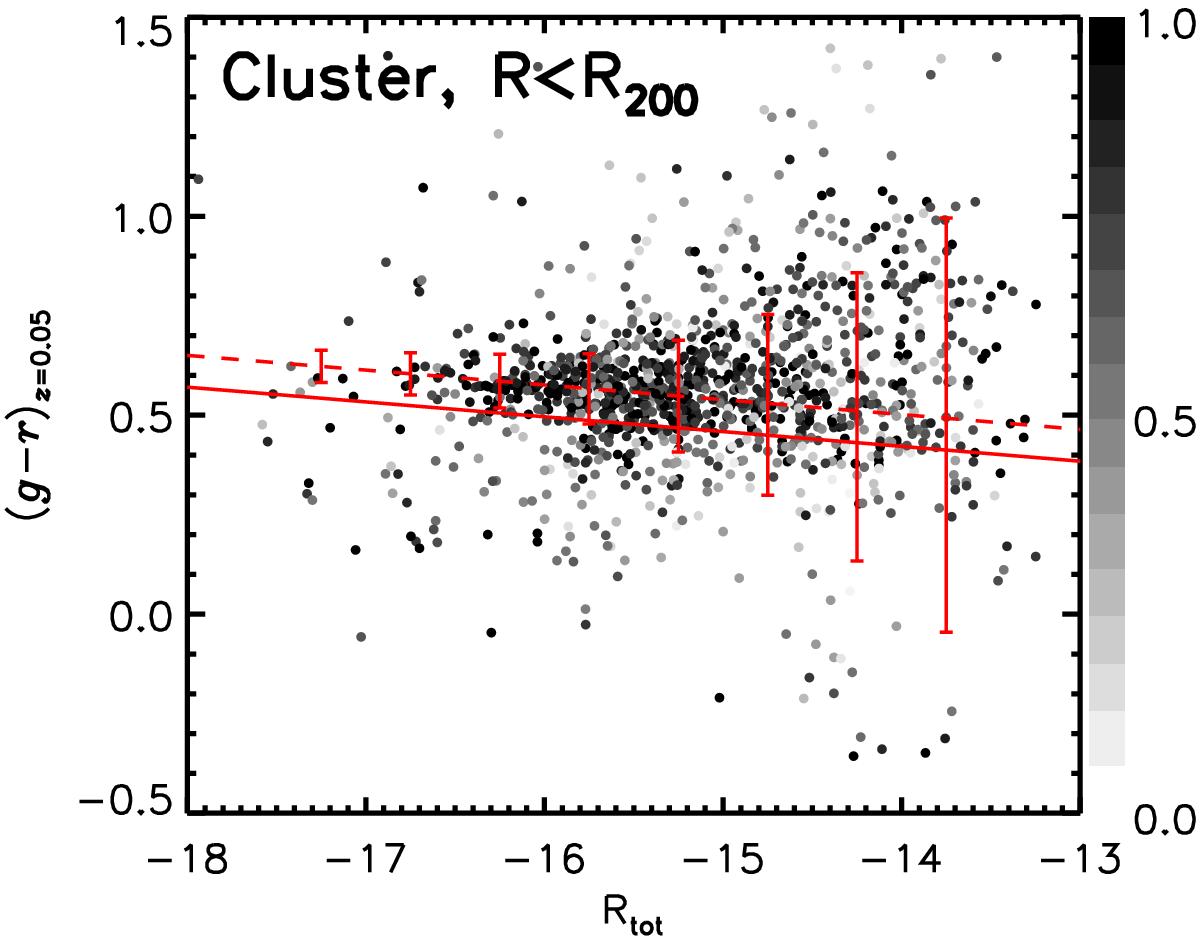
Same as Fig. 3, but selecting sources within R<R200, and subtracting the background statistically in each cluster field. Results are plotted as function of absolute r-band magnitude, and the (g − r)-colour is shifted to a common redshift of z = 0.05. Statistical weights (after background subtraction) are indicated in grey scale. The red solid line is the division used in vdB15 to separate red-sequence from bluer galaxies (now independent of redshift due to the shift). The dashed line is the same but off-set by 0.08 to approximately fit the red sequence. Error bars show median 1σ uncertainties on the colour measurements, in bins of magnitude.
Current usage metrics show cumulative count of Article Views (full-text article views including HTML views, PDF and ePub downloads, according to the available data) and Abstracts Views on Vision4Press platform.
Data correspond to usage on the plateform after 2015. The current usage metrics is available 48-96 hours after online publication and is updated daily on week days.
Initial download of the metrics may take a while.