Fig. 3
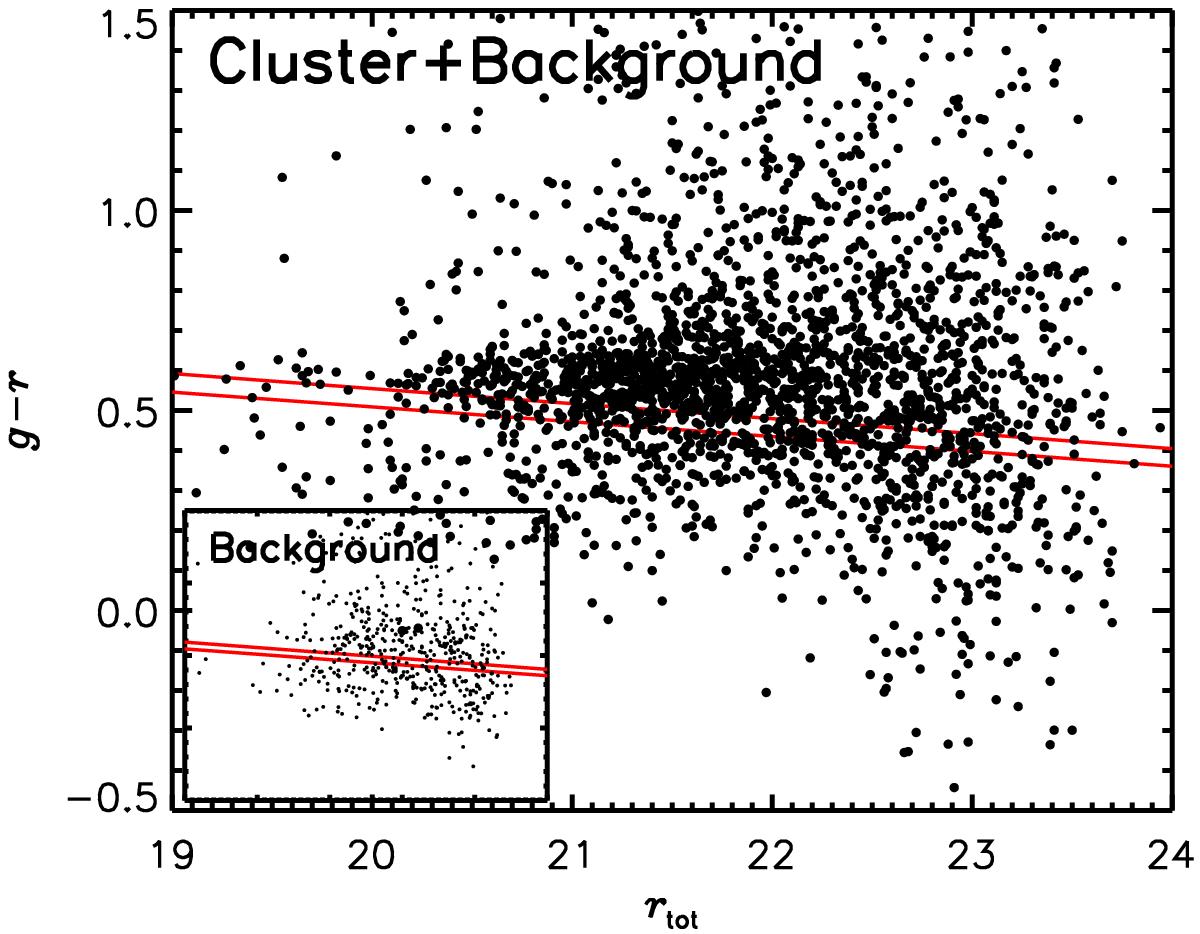
Main panel: g − r colour versus total r-band magnitude for the 2456 selected objects over 8 clusters. The red line marks the division line used in vdB15 to separate red-sequence galaxies from bluer galaxies for redshifts of z = 0.044 and z = 0.063, and should thus lie just below the red sequence. Inset panel: the colour−magnitude distribution of sources selected in the same way from the depth-matched CFHTLS fields (same parameter range).
Current usage metrics show cumulative count of Article Views (full-text article views including HTML views, PDF and ePub downloads, according to the available data) and Abstracts Views on Vision4Press platform.
Data correspond to usage on the plateform after 2015. The current usage metrics is available 48-96 hours after online publication and is updated daily on week days.
Initial download of the metrics may take a while.