Fig. 10
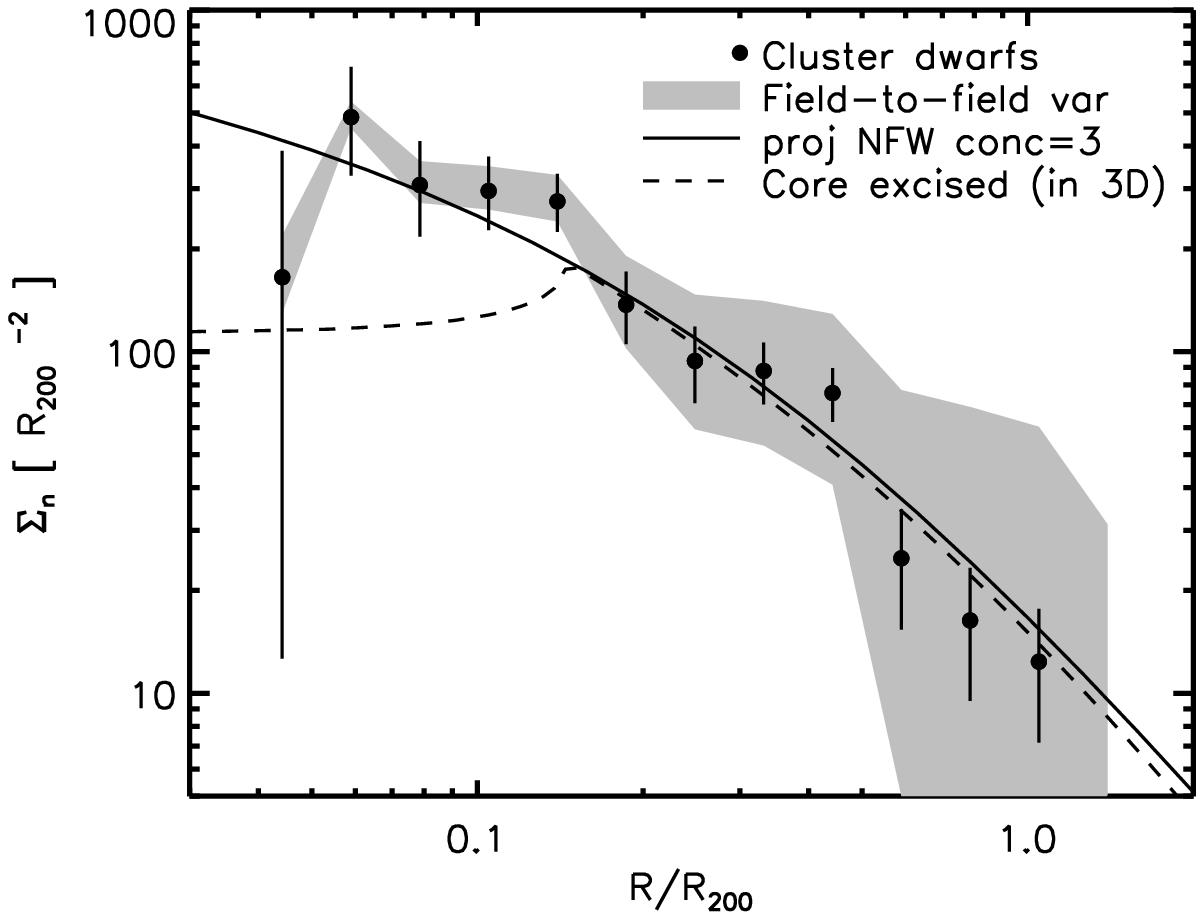
Same as Fig. 9, but for regular dwarf galaxies with similar luminosities as the UDGs. Dashed curve: same core-excised profile of Fig. 9, scaled in normalisation (by a factor 1.45 compared to the UDGs) to best fit the data outside the core. Solid curve: projected NFW profile with concentration parameter cNFW = 3, scaled in normalisation.
Current usage metrics show cumulative count of Article Views (full-text article views including HTML views, PDF and ePub downloads, according to the available data) and Abstracts Views on Vision4Press platform.
Data correspond to usage on the plateform after 2015. The current usage metrics is available 48-96 hours after online publication and is updated daily on week days.
Initial download of the metrics may take a while.