Fig. 1
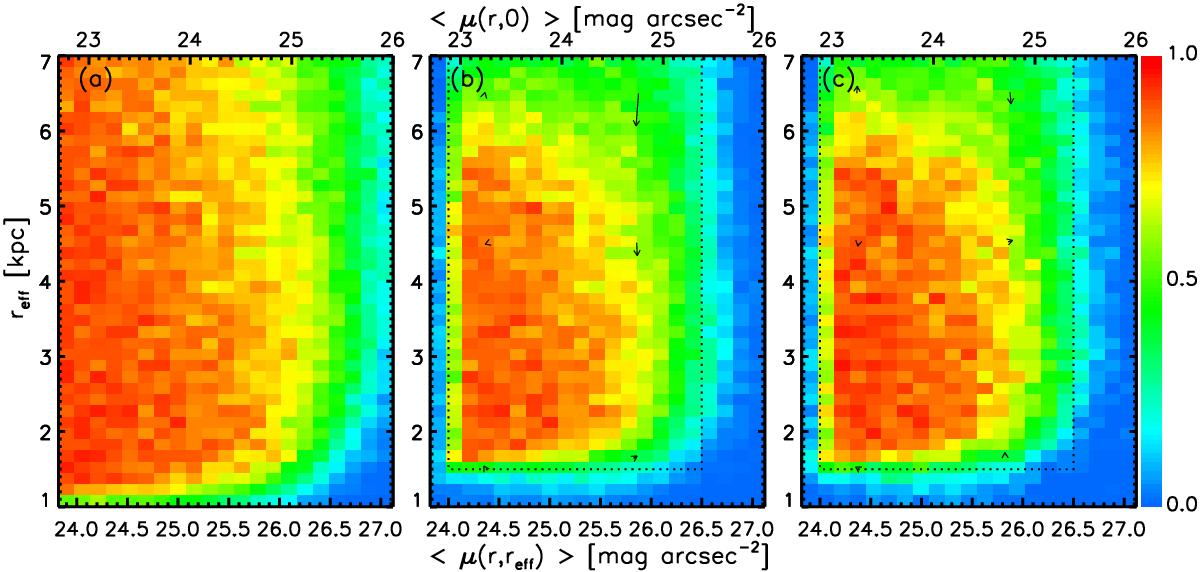
Recovered fraction of injected sources in the eight cluster fields, as a function of the circularized effective radius and the mean surface brightness within the effective radius. 80 000 sources have been simulated, with parameters drawn uniformly within the boundaries of the plot window, resulting in ~150 sources per histogram bin. a) Sources surviving the pre-selection based on SExtractor output parameters. b) Same but after applying the selection criteria (listed in Table 2, and indicated by the dotted region) on the best-fitting parameters from GALFIT. Arrows show the (small) bias between intrinsic and recovered parameters in 6 parts of covered parameter space. c) Same as panel b), but here from the four CFHTLS Deep fields, with noise added to resemble the quality of the data for the cluster fields. Note that the distributions are not completely smooth due to obscuration from unmasked sources in the images, which prevents the detection of faint extended galaxies (slightly more so in the cluster fields).
Current usage metrics show cumulative count of Article Views (full-text article views including HTML views, PDF and ePub downloads, according to the available data) and Abstracts Views on Vision4Press platform.
Data correspond to usage on the plateform after 2015. The current usage metrics is available 48-96 hours after online publication and is updated daily on week days.
Initial download of the metrics may take a while.