Fig. 15
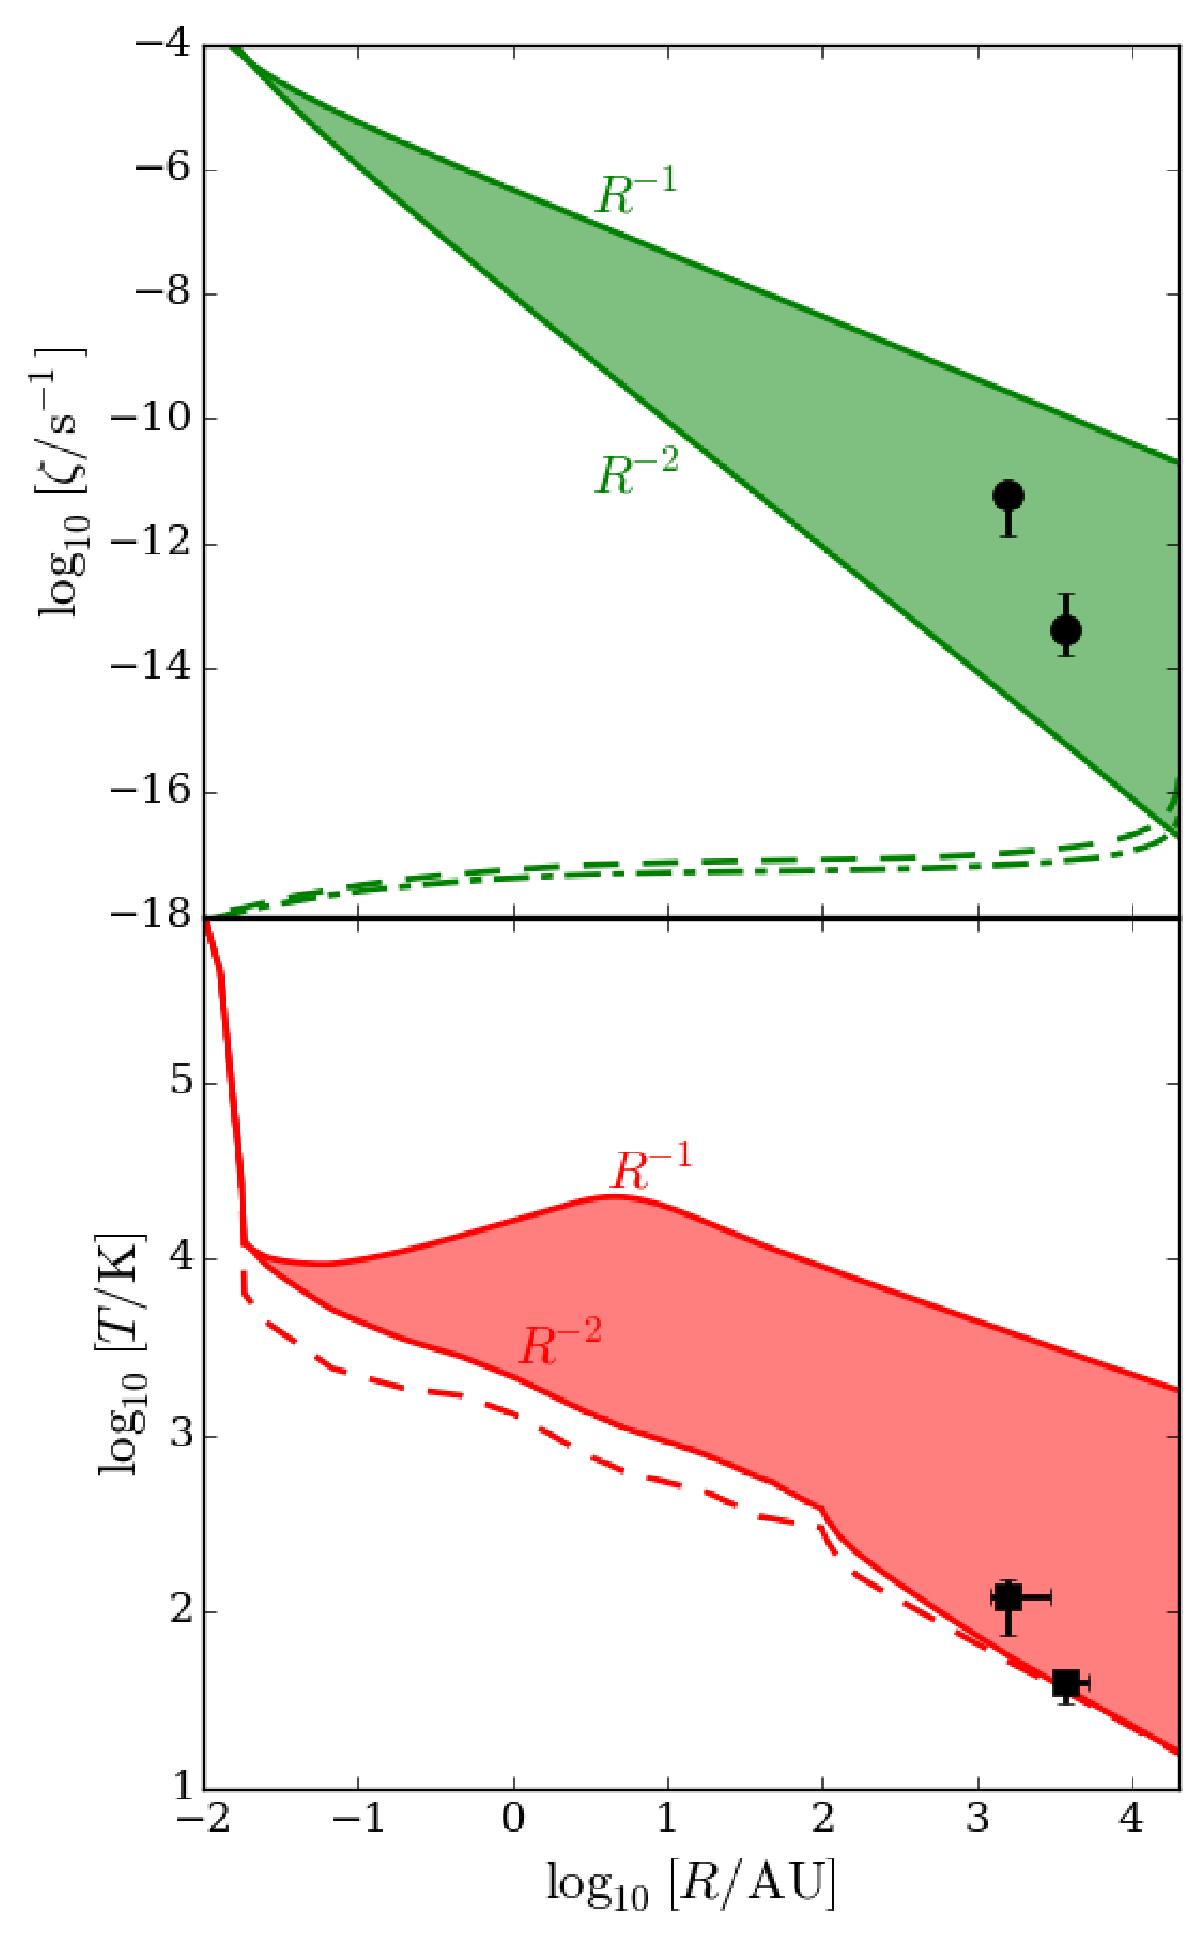
Ionisation rate (upper panel) and temperatures of gas and dust (lower panel) as a function of the distance from the protostar OMC-2 FIR 4. Observational estimates of ζ and Tg (black solid circles and squares, respectively; Ceccarelli et al. 2014) are compared to the results from the modelling described in Sect. 8.3 (green and red solid lines). The green and red shaded areas encompass the range of ζ and Tg by assuming a dilution factor R-1 (purely diffusive propagation) and R-2 (free-streaming propagation). The green dash-dotted and dashed lines show the interstellar CR ionisation rate assuming a spectrum similar to that from Voyager 1 (Stone et al. 2013) and an enhanced CR proton flux (see model H in Ivlev et al. 2015). The red dashed line shows the trend of the dust temperature (Masunaga & Inutsuka 2000; Crimier et al. 2009).
Current usage metrics show cumulative count of Article Views (full-text article views including HTML views, PDF and ePub downloads, according to the available data) and Abstracts Views on Vision4Press platform.
Data correspond to usage on the plateform after 2015. The current usage metrics is available 48-96 hours after online publication and is updated daily on week days.
Initial download of the metrics may take a while.