Fig. 8
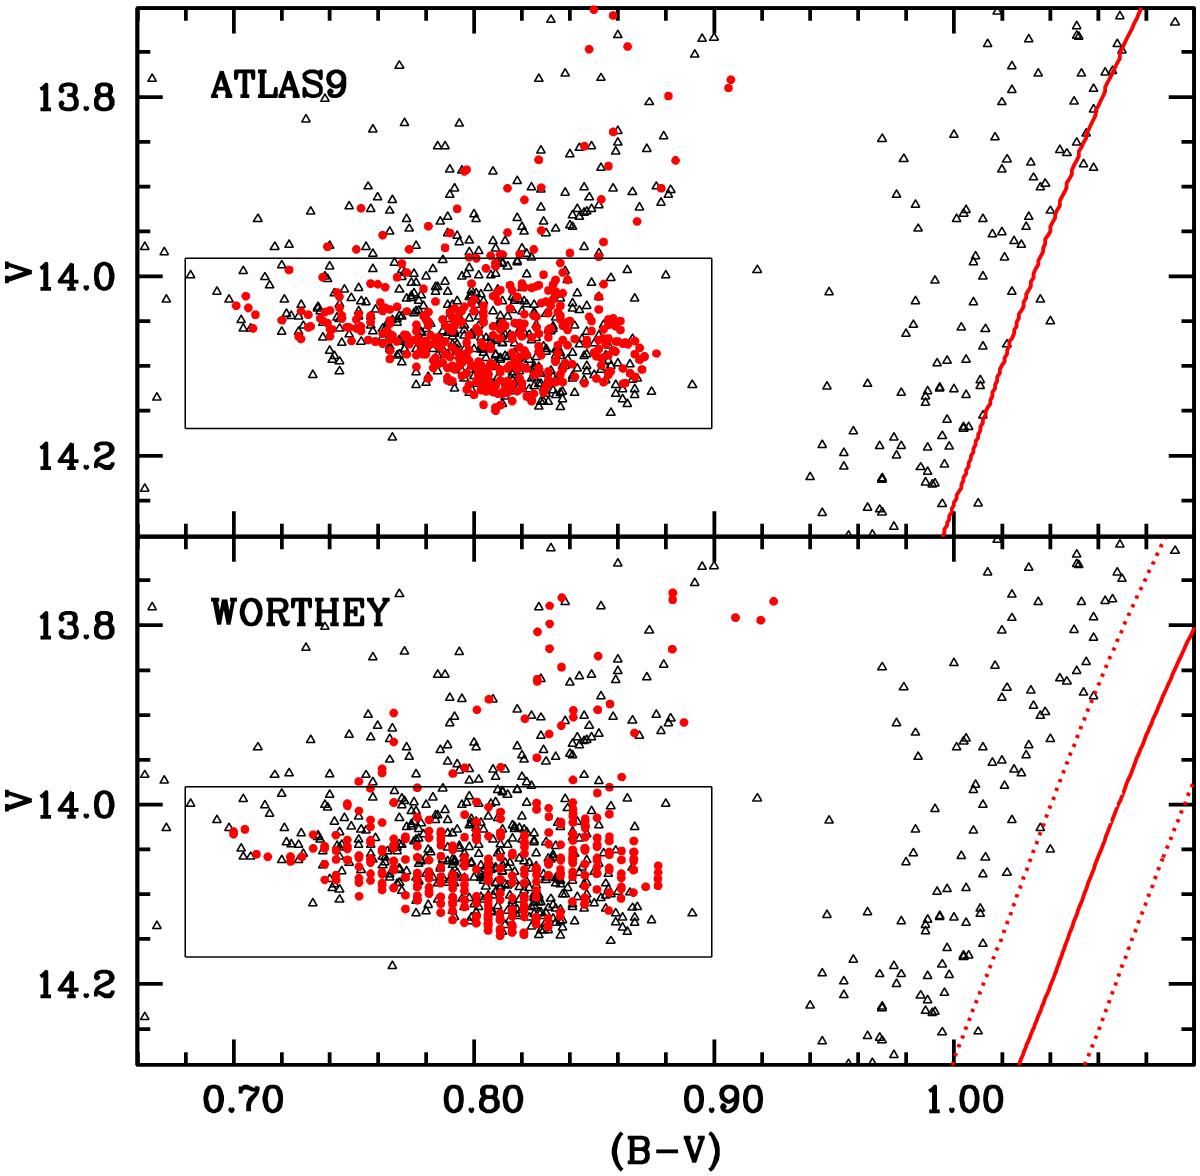
As Fig. 2 but including also the observed and theoretical RGB sequences. The top panel displays the [Fe/H] = − 0.7 baseline simulation employing the BaSTI adopted BCs and colour transformations (ATLAS9). The bottom panel shows the result for the baseline simulation but employing the empirical Worthey & Lee (2011) BCs and colour transformations (solid line). The reddest and bluest limits of the RGB colours according to the errors on the Worthey & Lee (2011) transformations and BCs are displayed as dotted lines (see text for details).
Current usage metrics show cumulative count of Article Views (full-text article views including HTML views, PDF and ePub downloads, according to the available data) and Abstracts Views on Vision4Press platform.
Data correspond to usage on the plateform after 2015. The current usage metrics is available 48-96 hours after online publication and is updated daily on week days.
Initial download of the metrics may take a while.