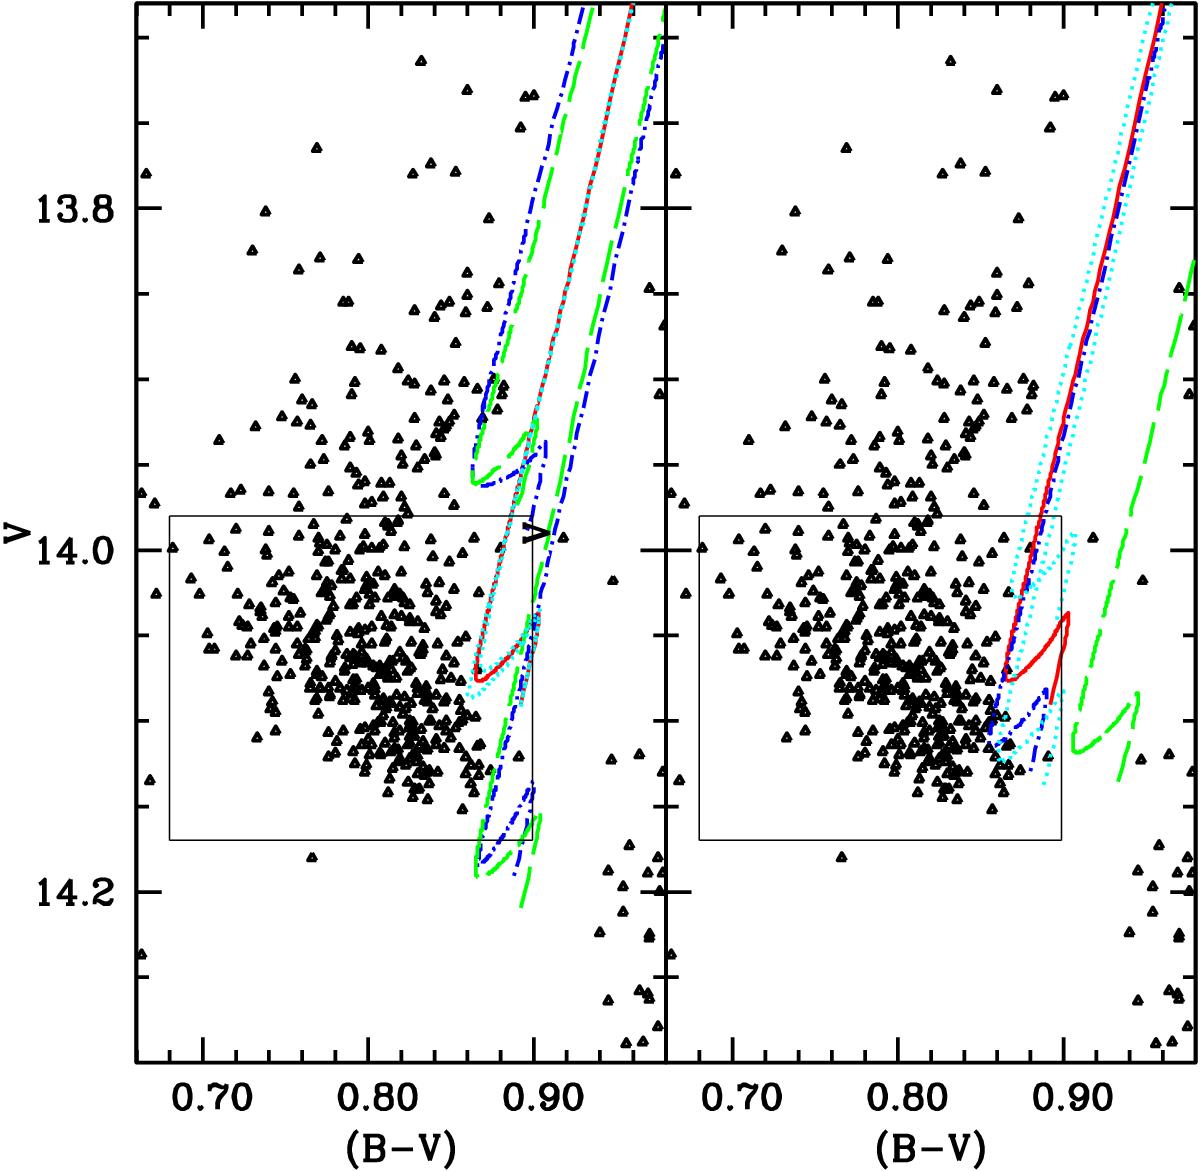
Fig. 7

As Fig. 6 but showing for the 0.8 M⊙ standard BaSTI track (solid line in both panels), the effect of changing the He-core mass at the He-flash by ±0.02 M⊙ (dashed lines in the left panel), the amount of He dredged to the surface by the first dredge up by δYFDU = ± 0.02 (dash-dotted lines in the left panel), the ![]() reaction rate (doubled and halved, respectively; dotted lines in the left panel), the mixing length αMLT by −0.15 (dashed line in the right panel), the Rosseland mean opacities by ±5% (dotted lines in the right panel), and the
reaction rate (doubled and halved, respectively; dotted lines in the left panel), the mixing length αMLT by −0.15 (dashed line in the right panel), the Rosseland mean opacities by ±5% (dotted lines in the right panel), and the ![]() reaction rate from the Angulo et al. (1999) to the Formicola et al. (2004) tabulations (dash-dotted line in the right panel).
reaction rate from the Angulo et al. (1999) to the Formicola et al. (2004) tabulations (dash-dotted line in the right panel).
Current usage metrics show cumulative count of Article Views (full-text article views including HTML views, PDF and ePub downloads, according to the available data) and Abstracts Views on Vision4Press platform.
Data correspond to usage on the plateform after 2015. The current usage metrics is available 48-96 hours after online publication and is updated daily on week days.
Initial download of the metrics may take a while.


