Fig. 8
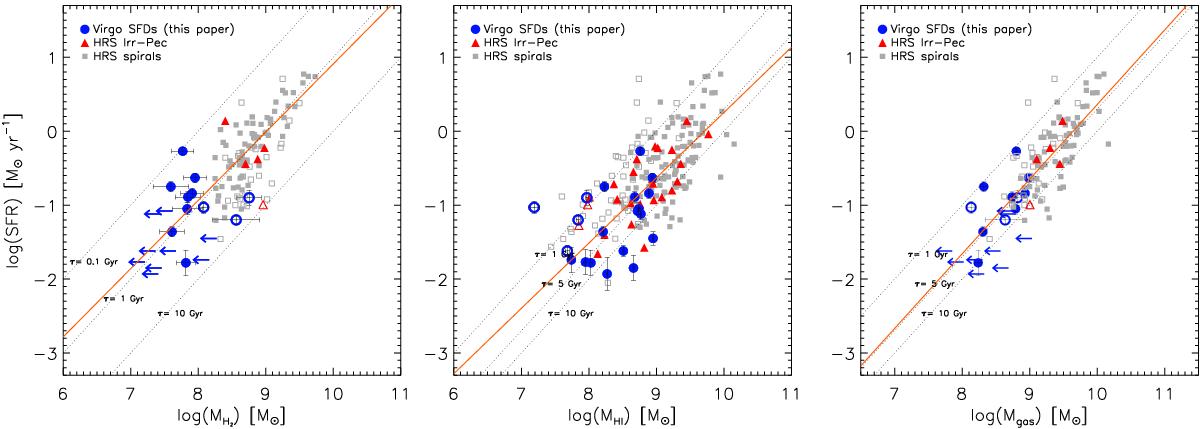
Left panel: star formation rate against H2 mass. Virgo SFDs (blue dots) are compared to the HRS spiral (grey squares) and irregular-peculiar (red triangles) galaxies. Hi-deficient galaxies are indicated with empty symbols, and blue arrows are Virgo dwarf upper limits. The solid line shows the best-fit relation. Dotted lines indicate constant molecular gas depletion timescales of 0.1, 1, and 10 Gyr. Central panel: star formation rate against Hi mass. Symbols are the same as in the left panel. The solid line shows the best-fit relation. Dotted lines indicate constant atomic gas depletion timescales of 1, 5, and 10 Gyr. Right panel: star formation rate against total gas mass (MH2 + MHI). Symbols are the same as in the left panel. The solid line shows the best-fit relation. Total gas depletion timescales of 1, 5, and 10 Gyr are also overlaid. Coefficients of the best-fit relations are given in Table 4.
Current usage metrics show cumulative count of Article Views (full-text article views including HTML views, PDF and ePub downloads, according to the available data) and Abstracts Views on Vision4Press platform.
Data correspond to usage on the plateform after 2015. The current usage metrics is available 48-96 hours after online publication and is updated daily on week days.
Initial download of the metrics may take a while.