Fig. 5
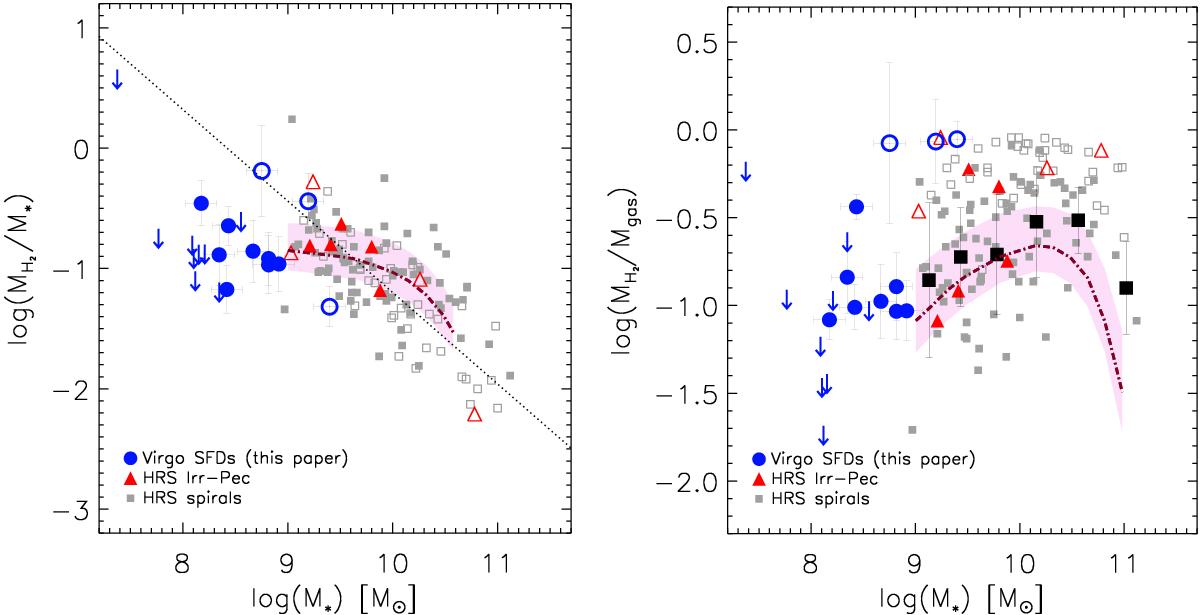
Left panel: ratio of H2 to stellar mass against stellar mass. Virgo SFDs (blue dots) are compared to spiral (grey squares) and irregular-peculiar (red triangles) galaxies from the HRS. Hi-deficient galaxies (DefHI> 0.5) in both samples are indicated with empty symbols. The dotted line shows the scaling relation obtained for the HRS galaxies with a normal Hi content (Boselli et al. 2014c). Right panel: molecular gas mass fraction against stellar mass. Symbols are the same as in the left panel. Large black squares show the average distribution of the HRS galaxies with a normal Hi content. The dot-dashed lines in both panels indicate the predictions of the model of Lu et al. (2015), and the shaded area corresponds to the uncertainty on the model.
Current usage metrics show cumulative count of Article Views (full-text article views including HTML views, PDF and ePub downloads, according to the available data) and Abstracts Views on Vision4Press platform.
Data correspond to usage on the plateform after 2015. The current usage metrics is available 48-96 hours after online publication and is updated daily on week days.
Initial download of the metrics may take a while.