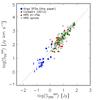
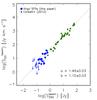
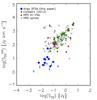
Fig. 3

Left: total CO(1−0) fluxes against total Herschel/SPIRE flux densities at 250 μm. Virgo SFD dwarfs (blue dots) are compared to Virgo spirals (green diamonds) from Corbelli et al. (2012), and spiral and irregular or peculiar galaxies from the HRS survey (grey squares and red triangles, respectively). The dotted line shows the best fit to the three samples. Centre: CO(1−0) fluxes within the ~22″ IRAM 30-m telescope beam against 250 μm flux densities measured within the same area. Here only Virgo SFD and spiral galaxies are shown. Right: total CO(1−0) fluxes against total WISE flux densities at 22 μm for Virgo and HRS samples. Symbols are the same as in the left panel.
Current usage metrics show cumulative count of Article Views (full-text article views including HTML views, PDF and ePub downloads, according to the available data) and Abstracts Views on Vision4Press platform.
Data correspond to usage on the plateform after 2015. The current usage metrics is available 48-96 hours after online publication and is updated daily on week days.
Initial download of the metrics may take a while.