Free Access
Fig. 14
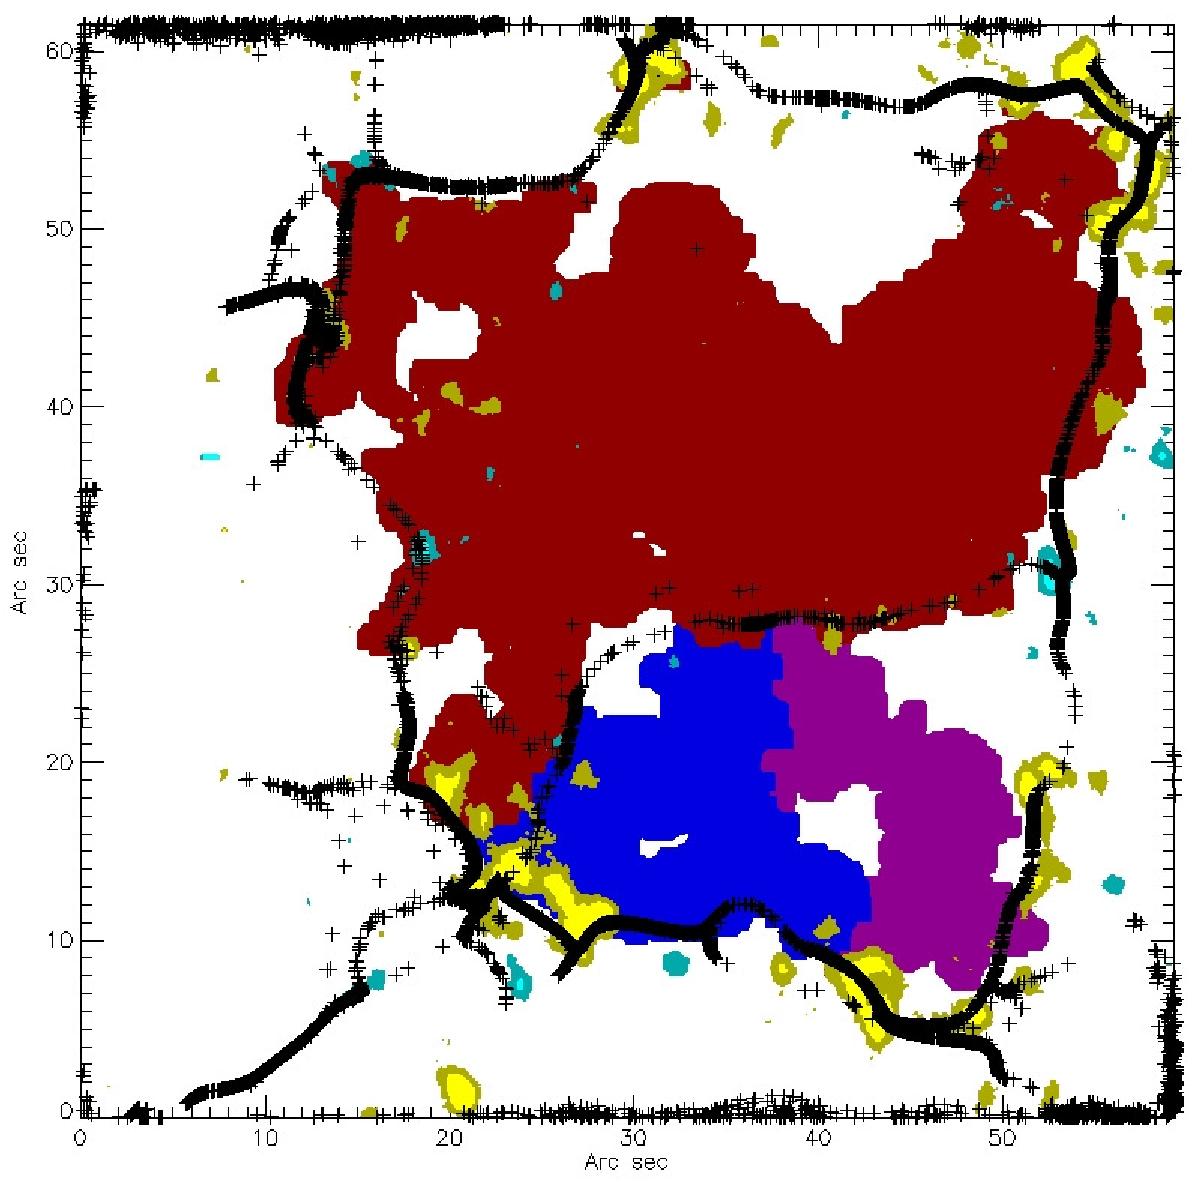
Cork locations (white cross) at the end of the 24-h sequence in the supergranule field; the corks are swept out at the border of the supergranule where the magnetic field is anchored. The most important families (three) at the end of the sequence are overplotted in various colors.
Current usage metrics show cumulative count of Article Views (full-text article views including HTML views, PDF and ePub downloads, according to the available data) and Abstracts Views on Vision4Press platform.
Data correspond to usage on the plateform after 2015. The current usage metrics is available 48-96 hours after online publication and is updated daily on week days.
Initial download of the metrics may take a while.