Fig. 10
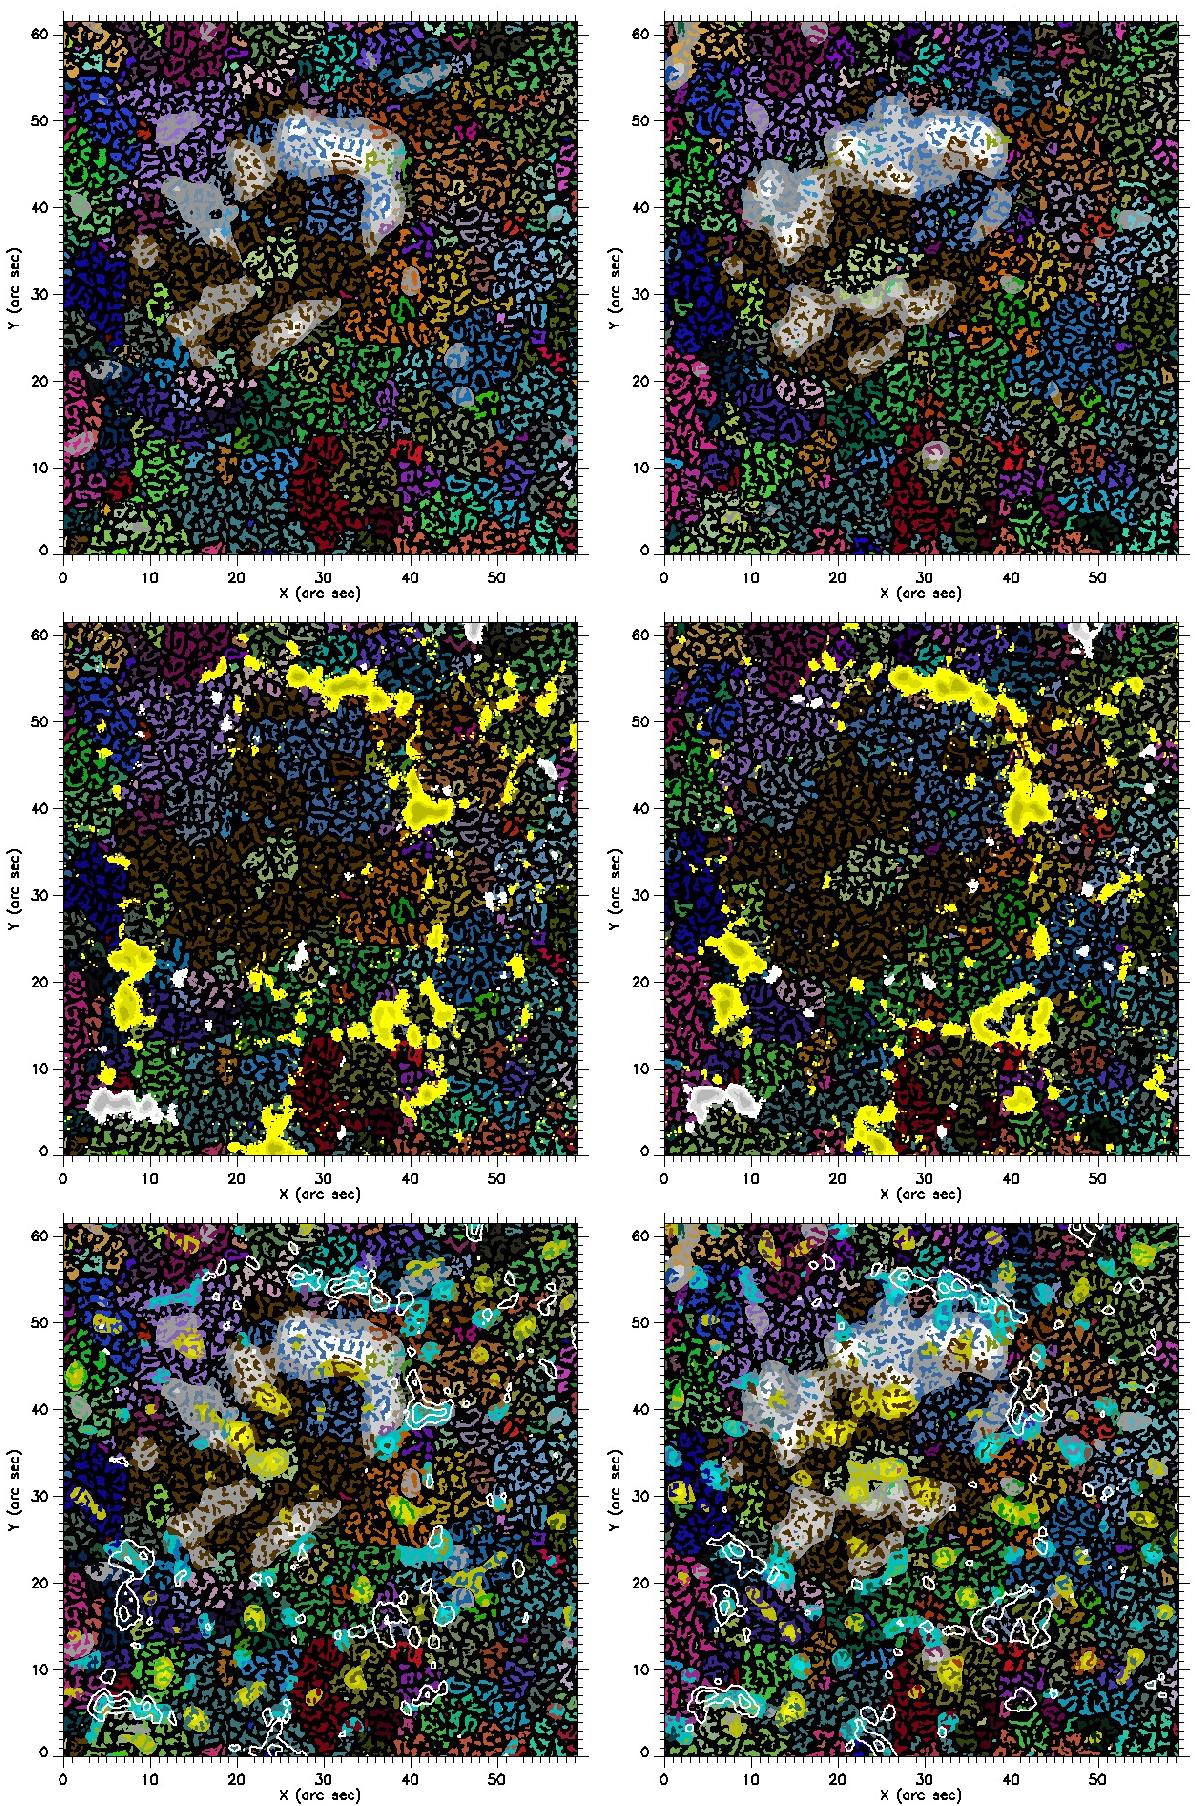
Evolution of the properties of a supergranular cell. An animation is available online. See Appendix A for details. Top left: horizontal velocity magnitude Vh_mag (gray levels) and families (TFG) at time 05:02. Top right: same plot at 05:36; families are represented by various individual colors. Middle left: longitudinal magnetic field (yellow and white) and families (TFG) at time 05:02. Middle right: same plot at 05:36. Bottom left: horizontal velocity magnitude Vh_mag (gray levels), families (TFG), absolute value of the longitudinal magnetic field (white isocontours) and velocity divergence (blue for negative, yellow for positive) at time 05:02; bottom right: same plot at 05:36.
Current usage metrics show cumulative count of Article Views (full-text article views including HTML views, PDF and ePub downloads, according to the available data) and Abstracts Views on Vision4Press platform.
Data correspond to usage on the plateform after 2015. The current usage metrics is available 48-96 hours after online publication and is updated daily on week days.
Initial download of the metrics may take a while.