Fig. 9
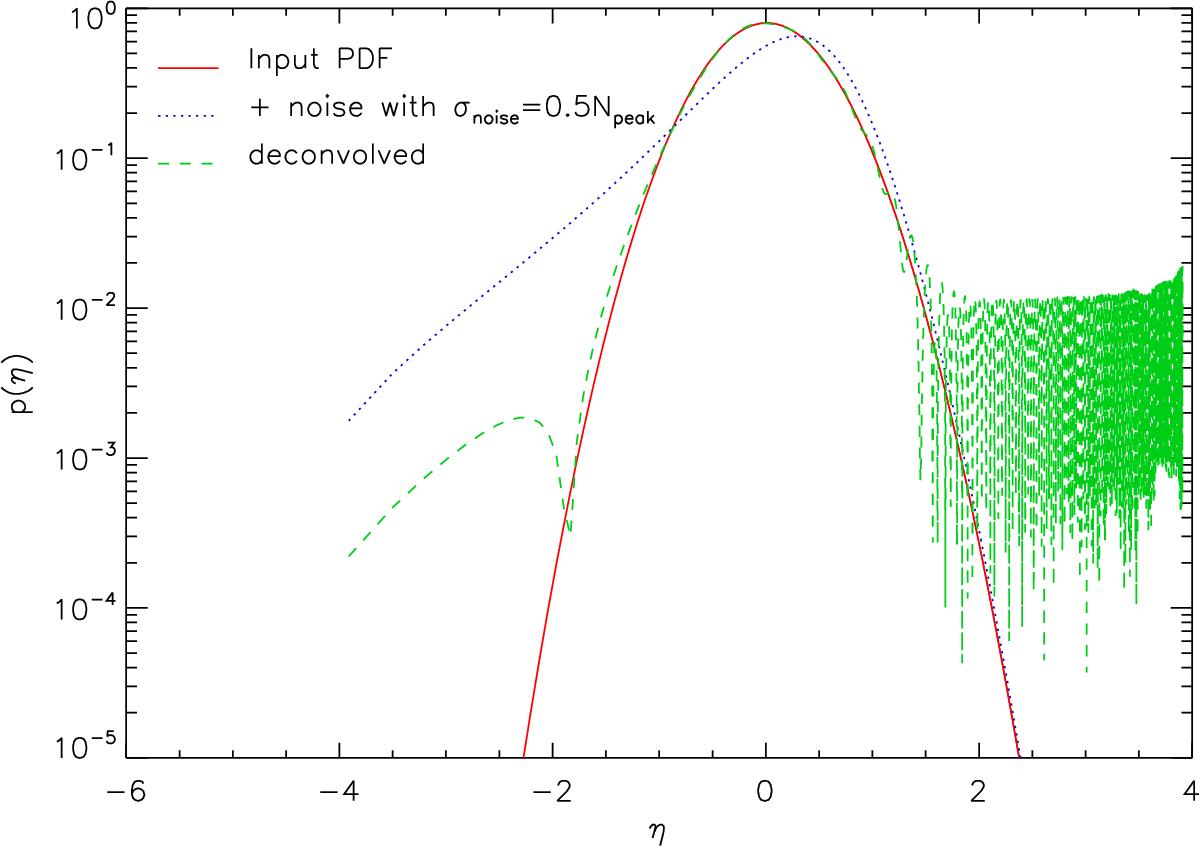
Result of the numerical deconvolution of a log-normal PDF contaminated by Gaussian noise with 0.5Npeak amplitude. The red solid line shows the input PDF before the noise contamination, the blue dotted line the contaminated PDFs, and the green dashed line the result of the deconvolution. The deconvolution artifacts at large column densities can be ignored as the measured noisy PDF already reflects the cloud PDF there.
Current usage metrics show cumulative count of Article Views (full-text article views including HTML views, PDF and ePub downloads, according to the available data) and Abstracts Views on Vision4Press platform.
Data correspond to usage on the plateform after 2015. The current usage metrics is available 48-96 hours after online publication and is updated daily on week days.
Initial download of the metrics may take a while.