Fig. 5
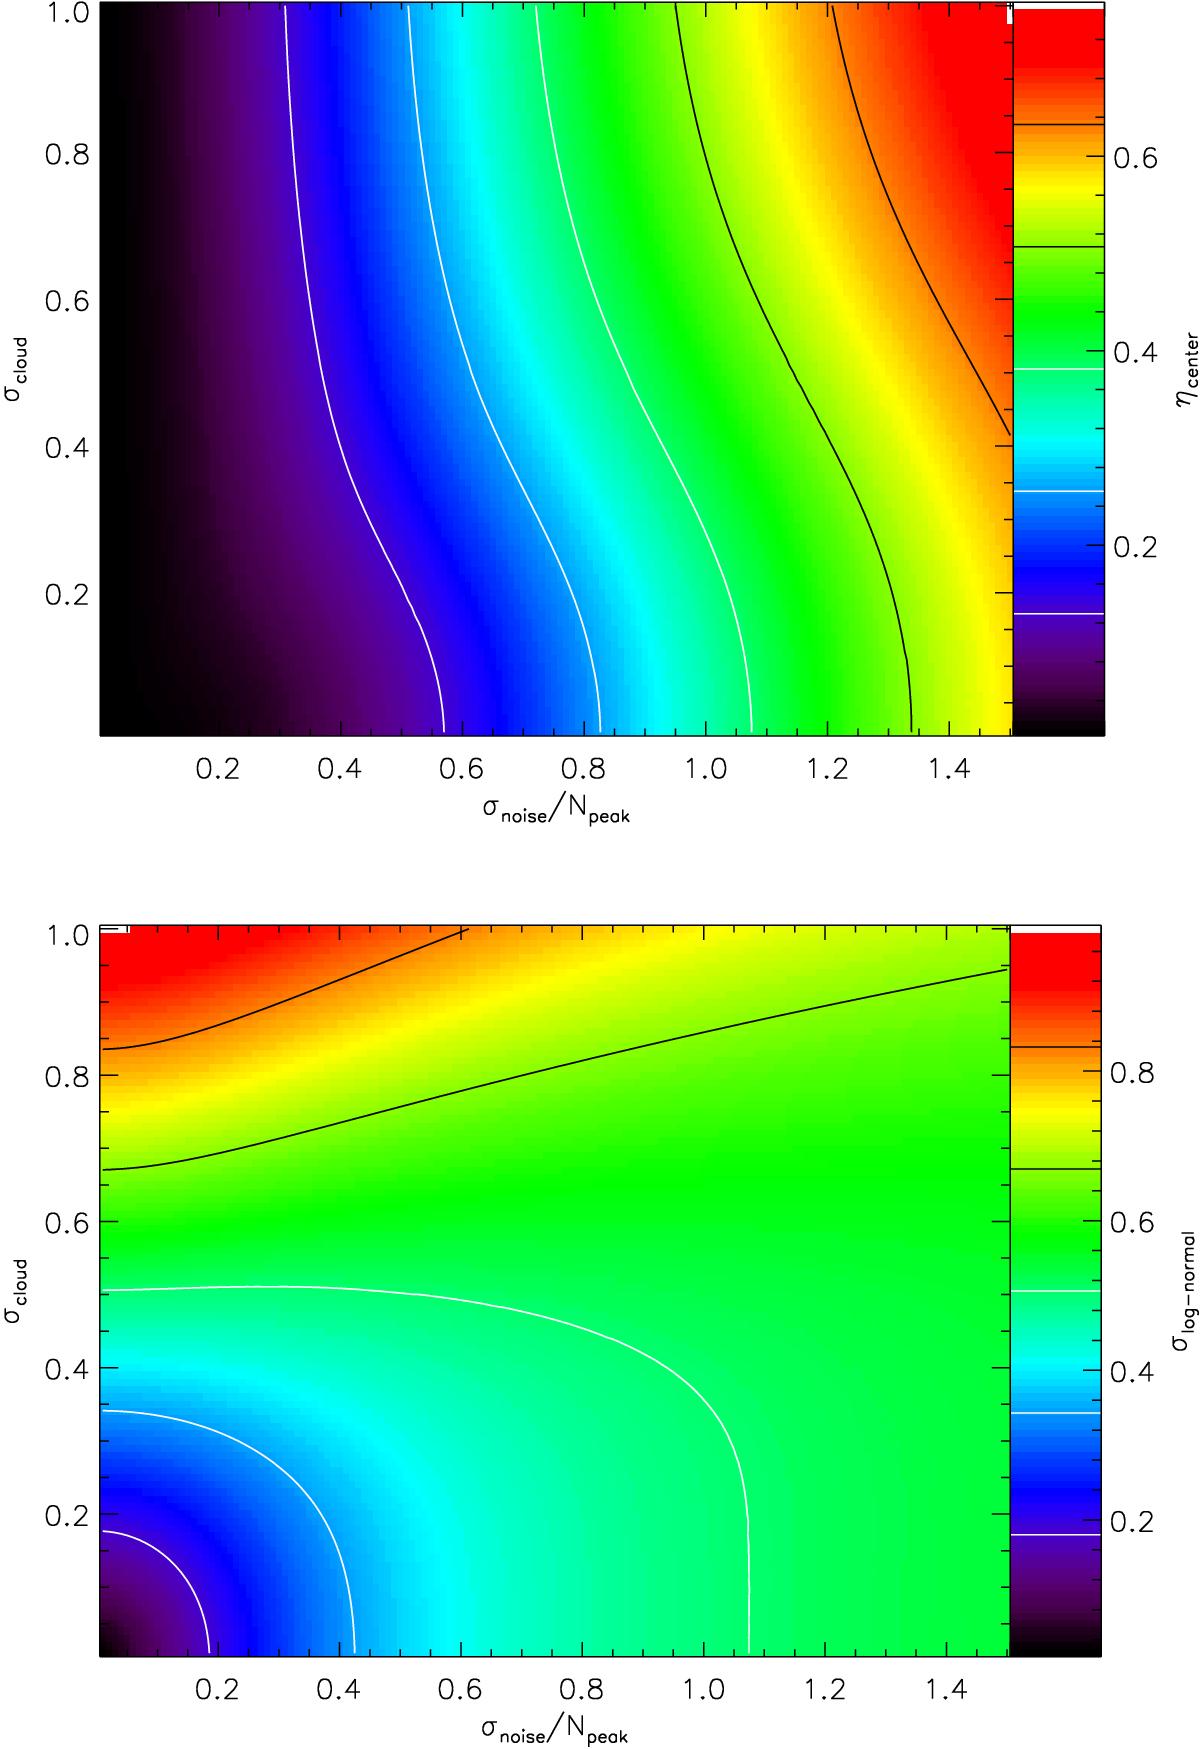
Variation of the parameters of a log-normal fit to the PDFs of noise-contaminated maps as a function of noise amplitude and the width of the original cloud PDF. The upper plot shows the measured location of the PDF center, the lower plot the width of the log-normal fit. Without noise contamination ηcenter = ηpeak = 0 and the measured width matches the PDF width of the cloud, σlog − normal = σcloud.
Current usage metrics show cumulative count of Article Views (full-text article views including HTML views, PDF and ePub downloads, according to the available data) and Abstracts Views on Vision4Press platform.
Data correspond to usage on the plateform after 2015. The current usage metrics is available 48-96 hours after online publication and is updated daily on week days.
Initial download of the metrics may take a while.