Fig. 4
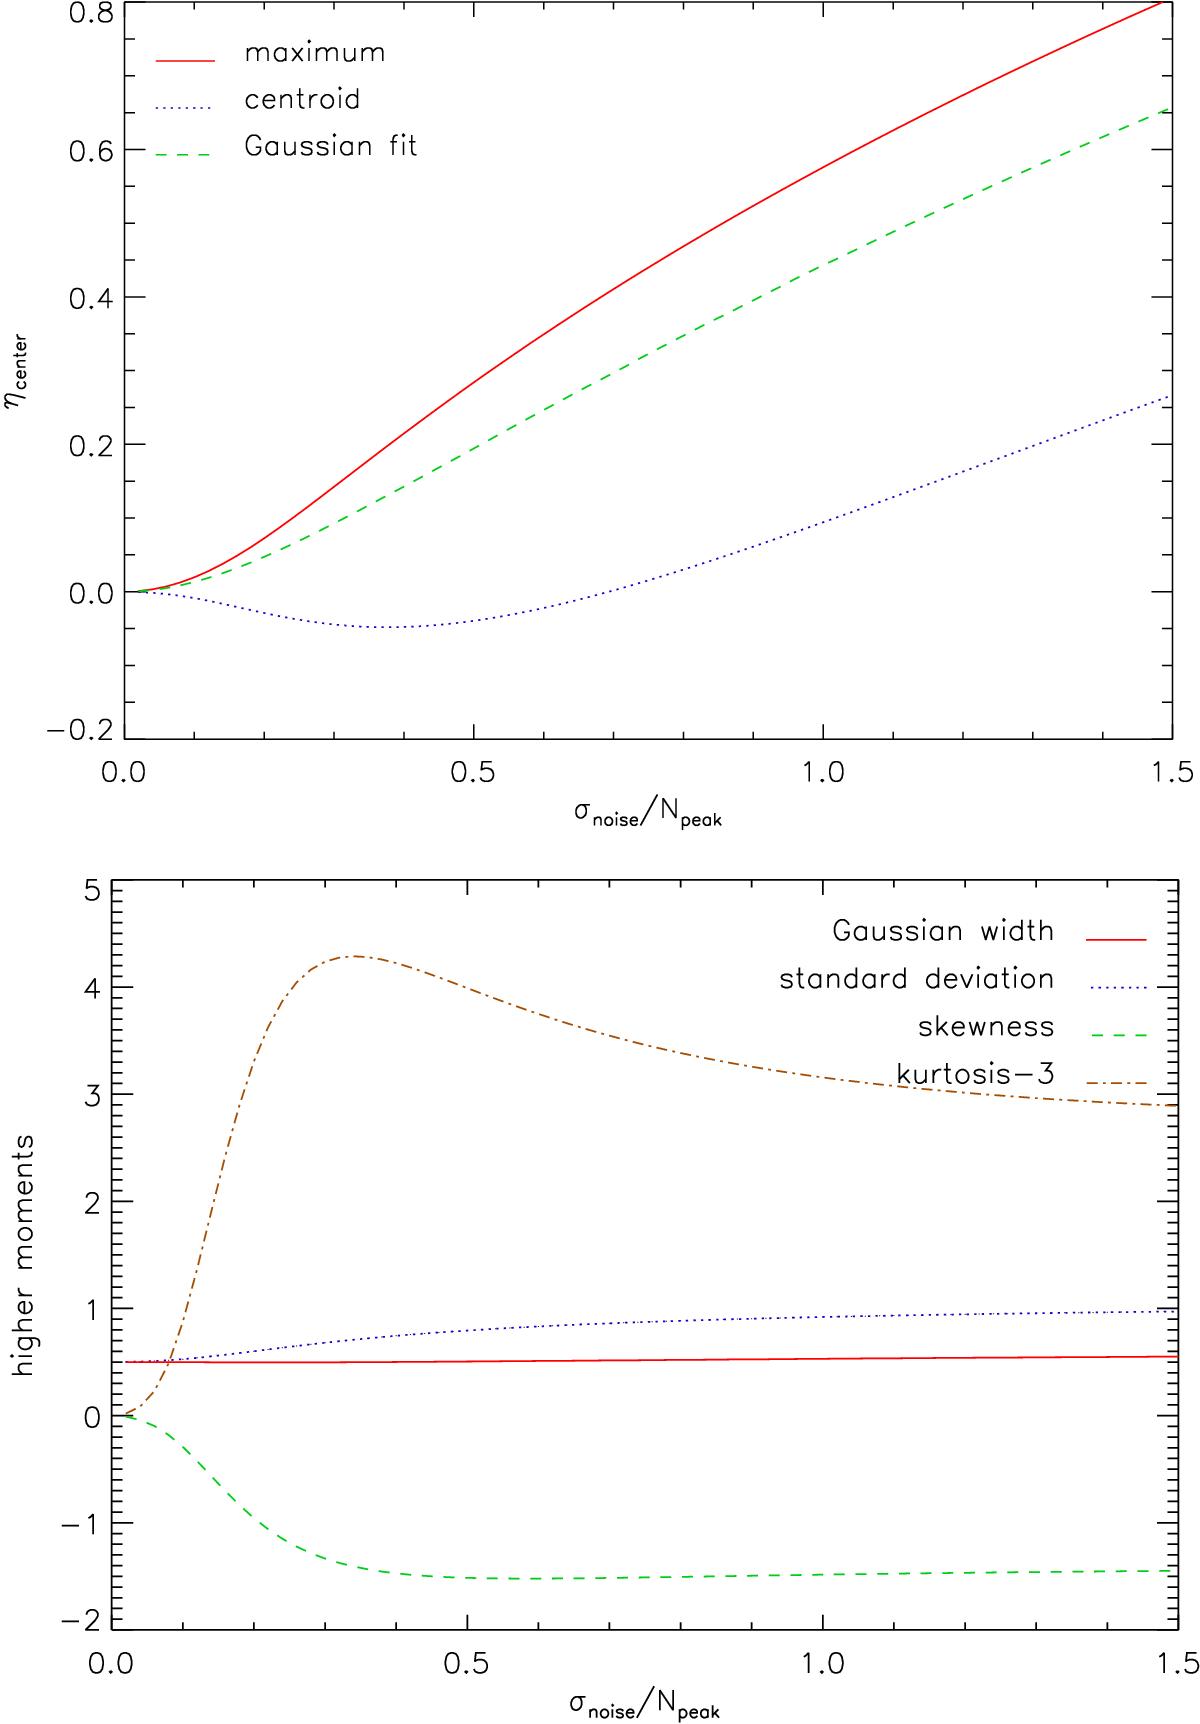
Change in the measured PDF parameters as a function of the noise amplitude. The upper plot shows the measured center position using three different measures of position. The red solid line shows the position of the maximum probability, the blue dotted line shows the first moment of the distribution, and the green dashed line gives the center of a Gaussian fit (in η). The lower plot displays the standard deviation along with the width of the Gaussian fit, also showing the higher moments.
Current usage metrics show cumulative count of Article Views (full-text article views including HTML views, PDF and ePub downloads, according to the available data) and Abstracts Views on Vision4Press platform.
Data correspond to usage on the plateform after 2015. The current usage metrics is available 48-96 hours after online publication and is updated daily on week days.
Initial download of the metrics may take a while.