Fig. 3
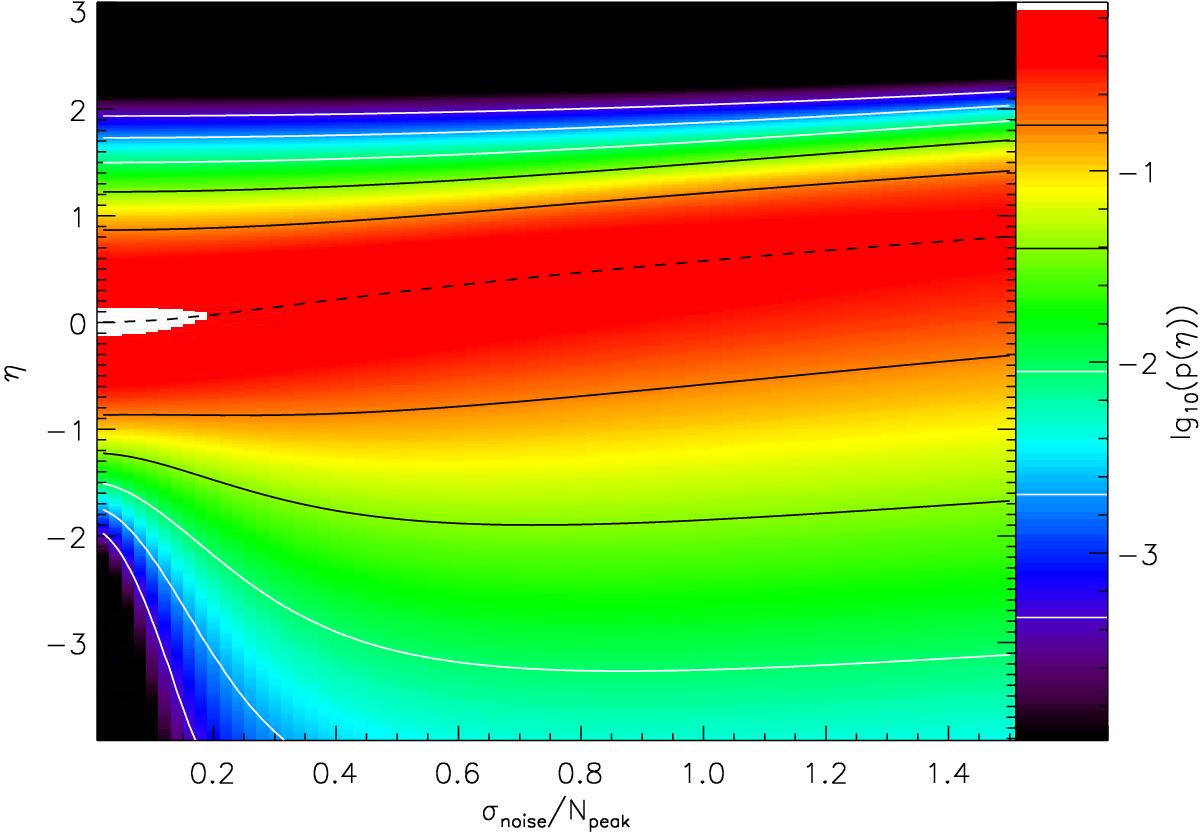
Distributions obtained from the convolution of a log-normal cloud PDF (Eq. (2) with ση,cloud = 0.5) with a Gaussian noise PDF (Eq. (5)) as a function of the noise amplitude (σnoise) relative to the peak of the log-normal distribution (Npeak). Contours and colors visualize the same data, given on a logarithmic scale. The individual contour levels are marked in the color bar. The left edge of the figure represents the original log-normal PDF. When increasing the noise level σnoise in the right direction, we see the distortion of the PDF mainly at low column densities η. The dashed line indicates the peak of the distribution, to better follow the shift of the PDF maximum to larger column densities with increasing noise level.
Current usage metrics show cumulative count of Article Views (full-text article views including HTML views, PDF and ePub downloads, according to the available data) and Abstracts Views on Vision4Press platform.
Data correspond to usage on the plateform after 2015. The current usage metrics is available 48-96 hours after online publication and is updated daily on week days.
Initial download of the metrics may take a while.