Fig. A.1
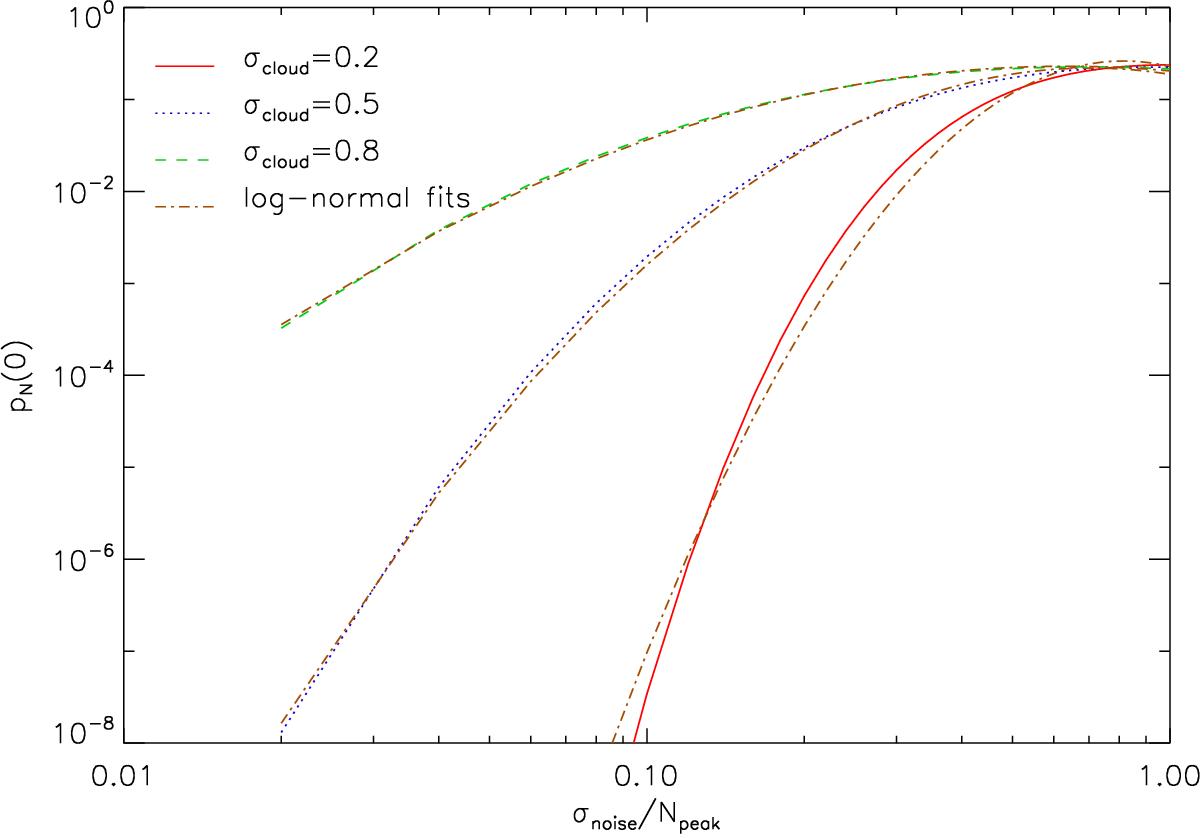
Demonstration of the log-normal behavior of the linear zero column density PDF pN(0) as a function of the observational noise level. The three colored curves represent horizontal cuts through the surface shown in Fig. 8 for different values of the cloud PDF width. The brown dashed-dotted lines show the corresponding log-normal fits to the curves.
Current usage metrics show cumulative count of Article Views (full-text article views including HTML views, PDF and ePub downloads, according to the available data) and Abstracts Views on Vision4Press platform.
Data correspond to usage on the plateform after 2015. The current usage metrics is available 48-96 hours after online publication and is updated daily on week days.
Initial download of the metrics may take a while.