Fig. 2
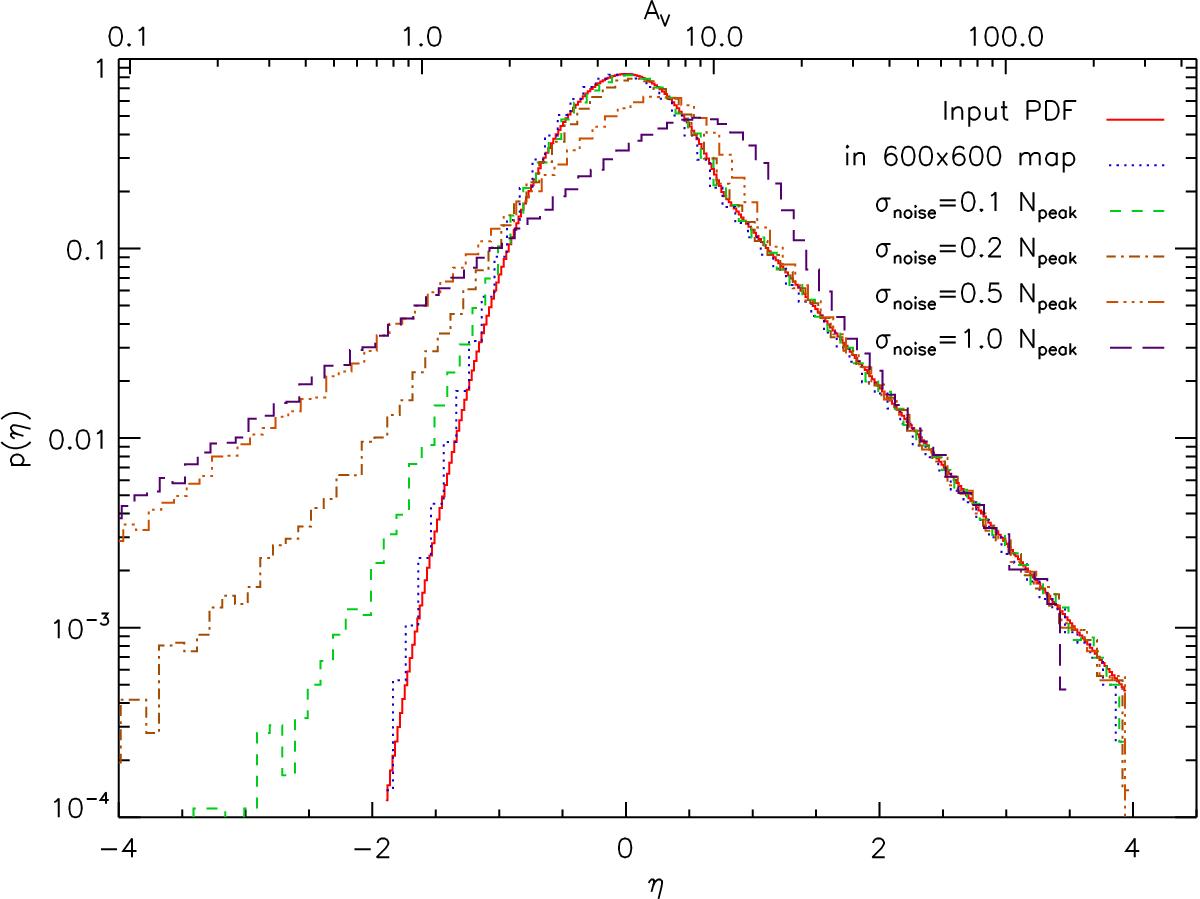
Impact of observational noise on the PDF measured for the cloud from Fig. 1. The red solid curve shows the analytic description of the input PDF, the blue dotted line is the measured PDF of the fractal map with a finite pixel number. The other broken lines show the column density PDF that is measured if the map is affected by different levels of observational noise, characterized by a normal distribution with a standard deviation from 10% to 100% of the peak column density.
Current usage metrics show cumulative count of Article Views (full-text article views including HTML views, PDF and ePub downloads, according to the available data) and Abstracts Views on Vision4Press platform.
Data correspond to usage on the plateform after 2015. The current usage metrics is available 48-96 hours after online publication and is updated daily on week days.
Initial download of the metrics may take a while.