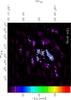
Fig. 17
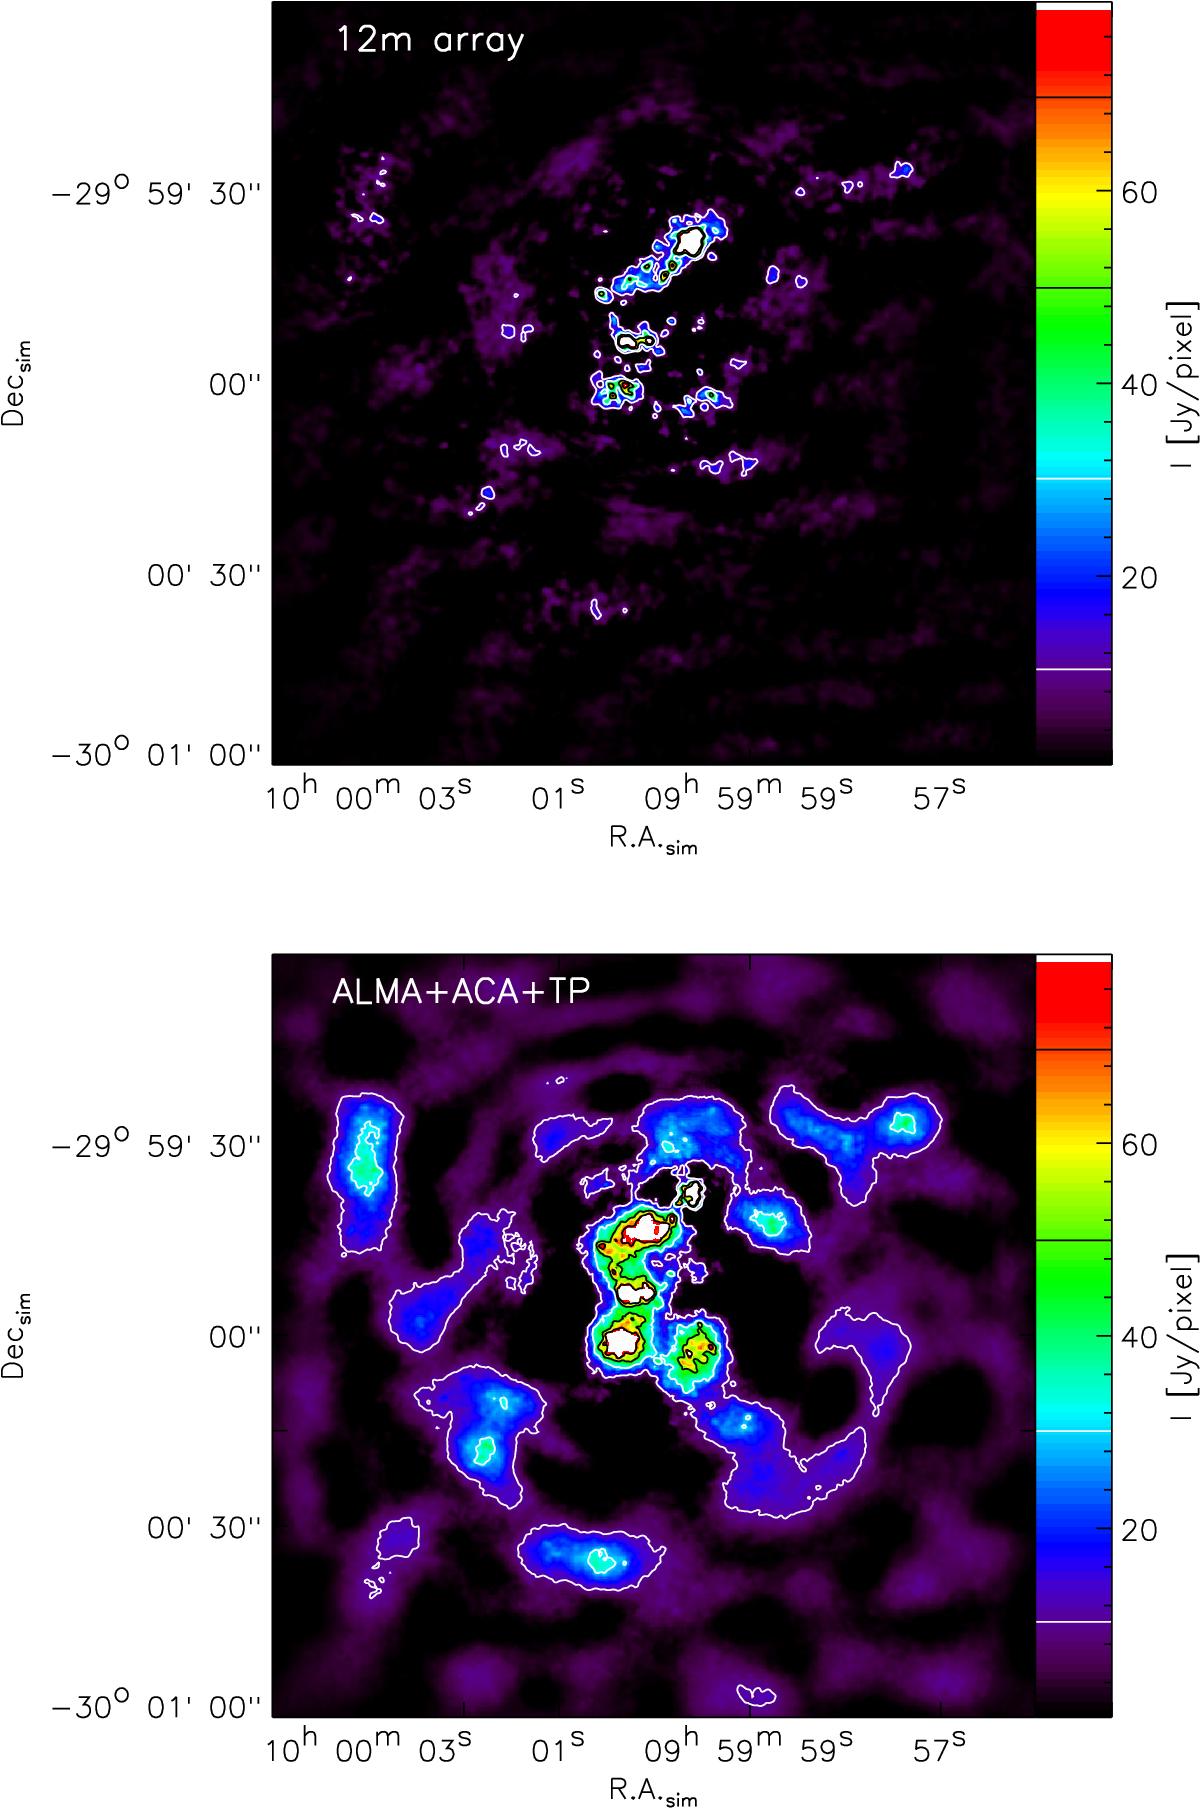
Result of a simulated 2 h ALMA observation of the cloud shown in Fig. 1 where we translated the optical depth AV into an equivalent 230 GHz intensity. Upper plot: map obtained when using the 12 m array without short-spacing correction. Lower plot: map obtained after combining the 12 m array data with the data from the compact array and single-dish zero spacing. The intermediate map obtained from combining only the ALMA 12 m and ACA results is hardly distinguishable visually from the map in the lower plot, so it is not shown here.
Current usage metrics show cumulative count of Article Views (full-text article views including HTML views, PDF and ePub downloads, according to the available data) and Abstracts Views on Vision4Press platform.
Data correspond to usage on the plateform after 2015. The current usage metrics is available 48-96 hours after online publication and is updated daily on week days.
Initial download of the metrics may take a while.