Fig. 16
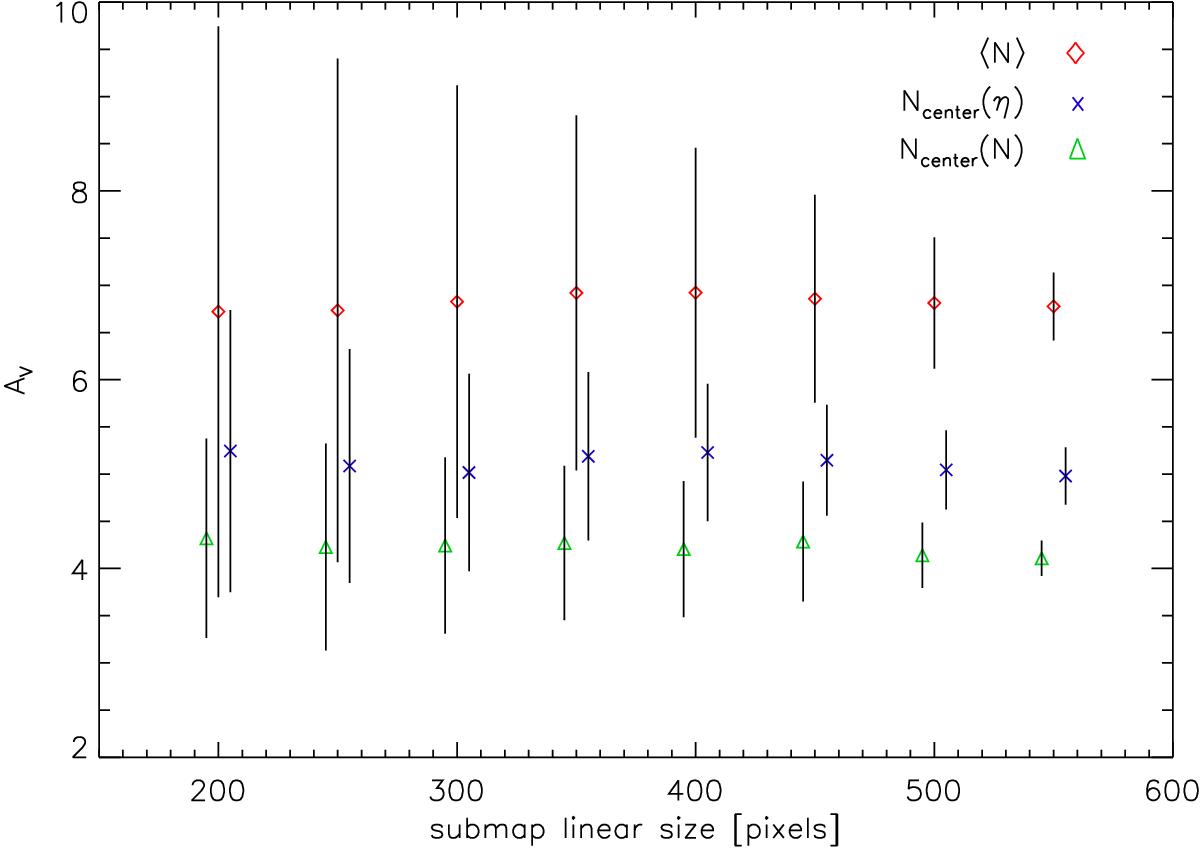
Column density distribution parameters of randomly selected submaps of Fig. 1 as a function of their size. The symbols show the mean from an ensemble of 50 submaps and error bars represent the standard deviation. Red diamonds show the average map density, blue crosses give the PDF peak on the logarithmic scale, and green triangles the peak on the linear density scale. The symbols and error bars for the two PDF peaks are displaced by ±5 pixels relative to the actual submap size for a better visibility in the plot.
Current usage metrics show cumulative count of Article Views (full-text article views including HTML views, PDF and ePub downloads, according to the available data) and Abstracts Views on Vision4Press platform.
Data correspond to usage on the plateform after 2015. The current usage metrics is available 48-96 hours after online publication and is updated daily on week days.
Initial download of the metrics may take a while.