Fig. 15
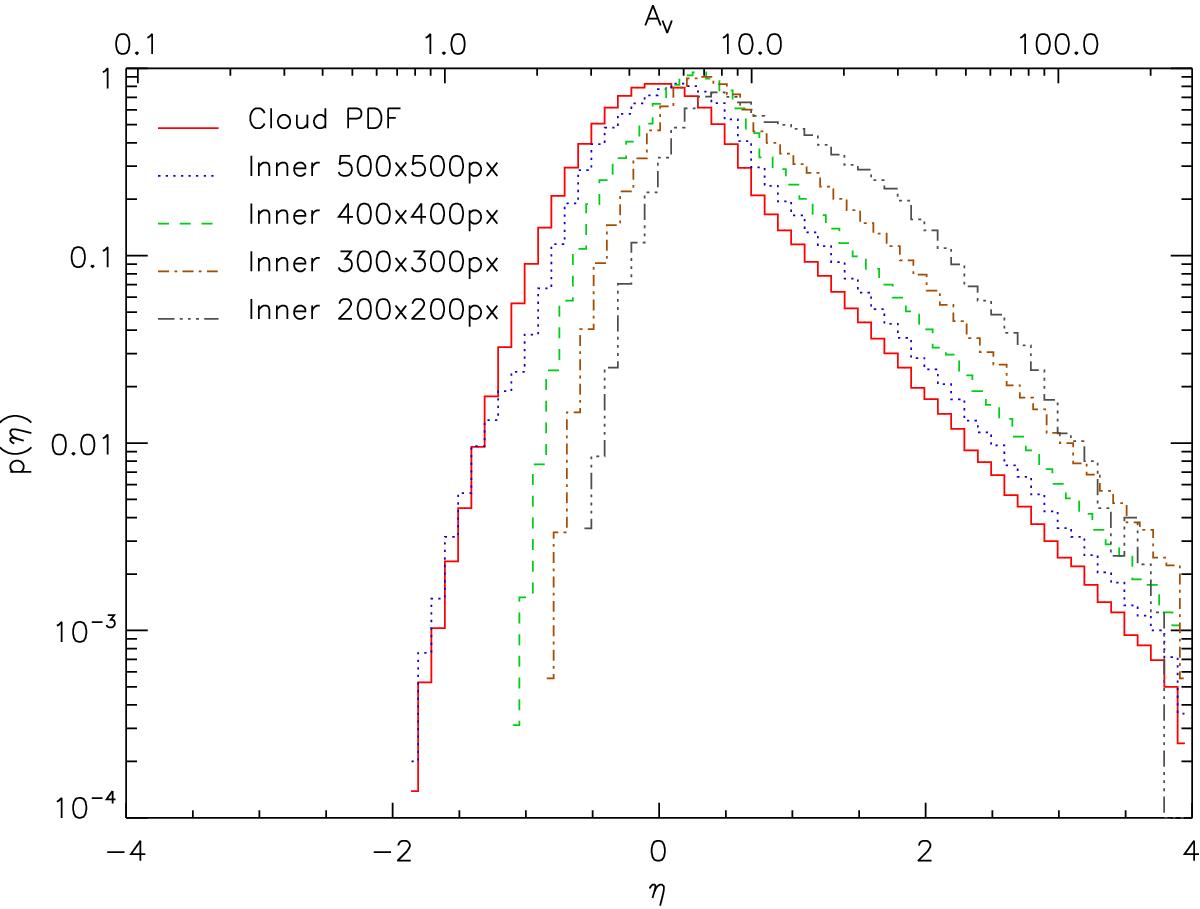
Result of partial observations focusing on the center of the cloud. PDFs are measured for the four submaps of different sizes indicated in Fig. 1. Up to a map size of 300 × 300 pixels, all high-column-density spots are included in the map. A smaller map truncates some parts of the high-density center of the map leading to a noticeable distortion of the power-law tail. The submap sizes correspond to 69%, 44%, 25%, and 11% of the original map area.
Current usage metrics show cumulative count of Article Views (full-text article views including HTML views, PDF and ePub downloads, according to the available data) and Abstracts Views on Vision4Press platform.
Data correspond to usage on the plateform after 2015. The current usage metrics is available 48-96 hours after online publication and is updated daily on week days.
Initial download of the metrics may take a while.