Fig. 14
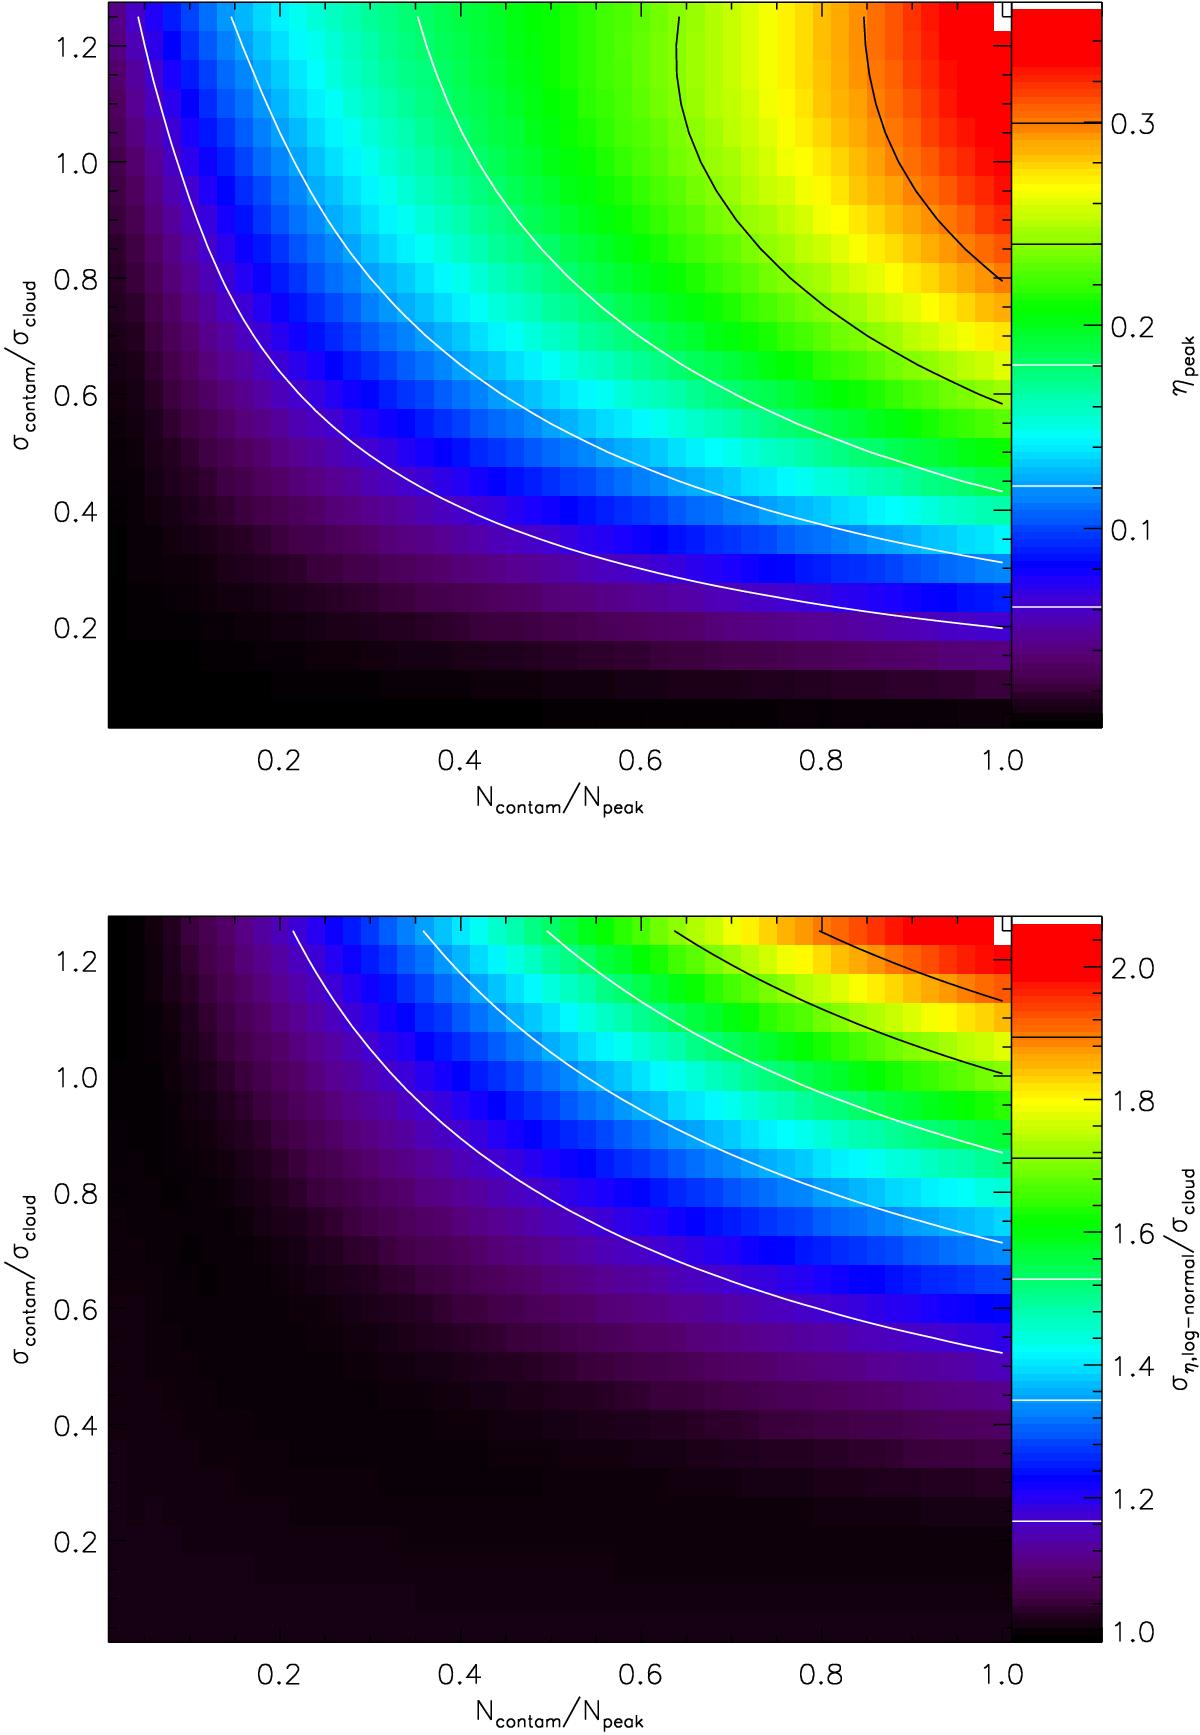
Parameters of the PDFs of contaminated clouds corrected for the contamination through the subtraction of a constant offset given by the peak of the contaminating structure PDF. Upper plot: position of the PDF peak on the logarithmic η scale, i.e., a value of 0 represents the correct peak position and a value of 0.3 stands for a 35% overestimate of the peak density. Lower plot: width of the corrected cloud PDF relative to the original cloud PDF. In both plots we varied the amplitude of the contamination in horizontal direction and the width of the contaminating PDF in vertical direction.
Current usage metrics show cumulative count of Article Views (full-text article views including HTML views, PDF and ePub downloads, according to the available data) and Abstracts Views on Vision4Press platform.
Data correspond to usage on the plateform after 2015. The current usage metrics is available 48-96 hours after online publication and is updated daily on week days.
Initial download of the metrics may take a while.