Fig. 13
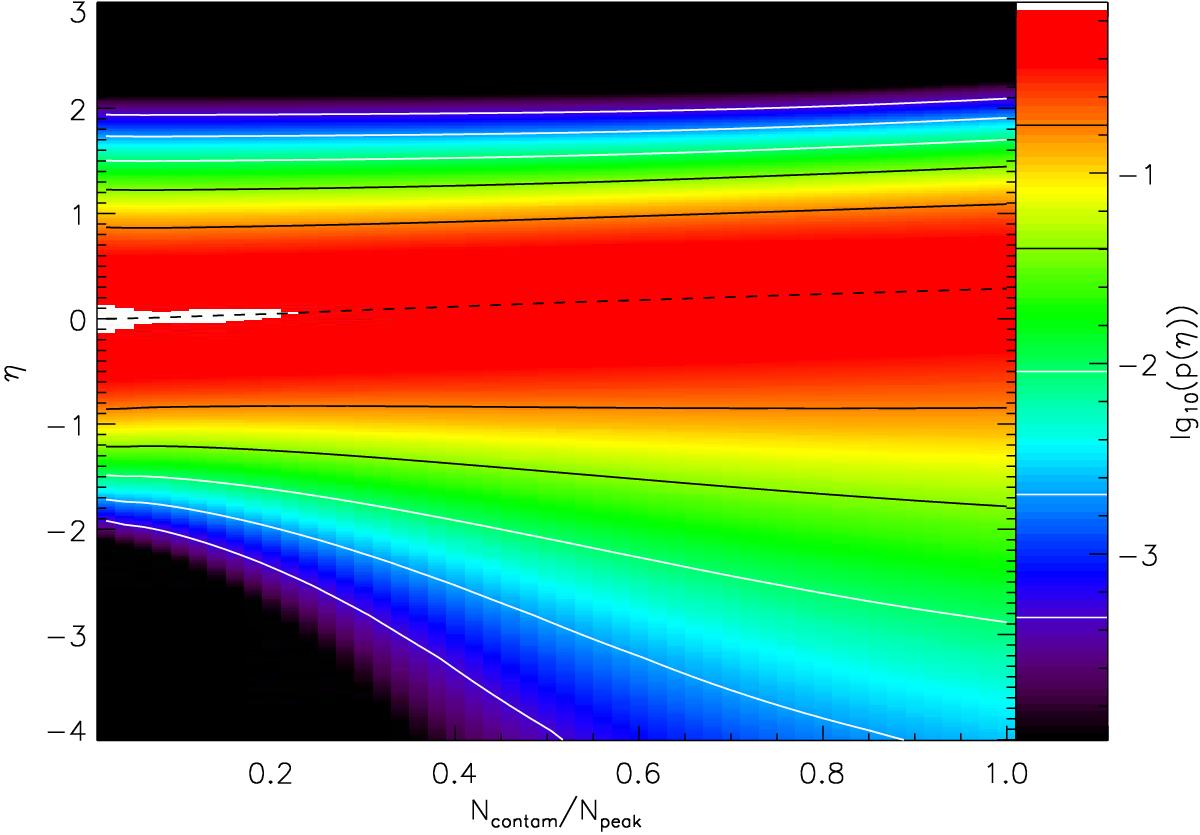
PDFs of contaminated clouds, corrected for contamination by subtraction of a constant offset of the peak of the contaminating structure’s PDF. PDFs are plotted as a function of the contamination density, Ncontam, using a fixed width of the contamination PDF of σcontam = 0.5 matching the width of the main cloud PDF. Corrected distributions are represented by colors showing the logarithm of the PDF.
Current usage metrics show cumulative count of Article Views (full-text article views including HTML views, PDF and ePub downloads, according to the available data) and Abstracts Views on Vision4Press platform.
Data correspond to usage on the plateform after 2015. The current usage metrics is available 48-96 hours after online publication and is updated daily on week days.
Initial download of the metrics may take a while.