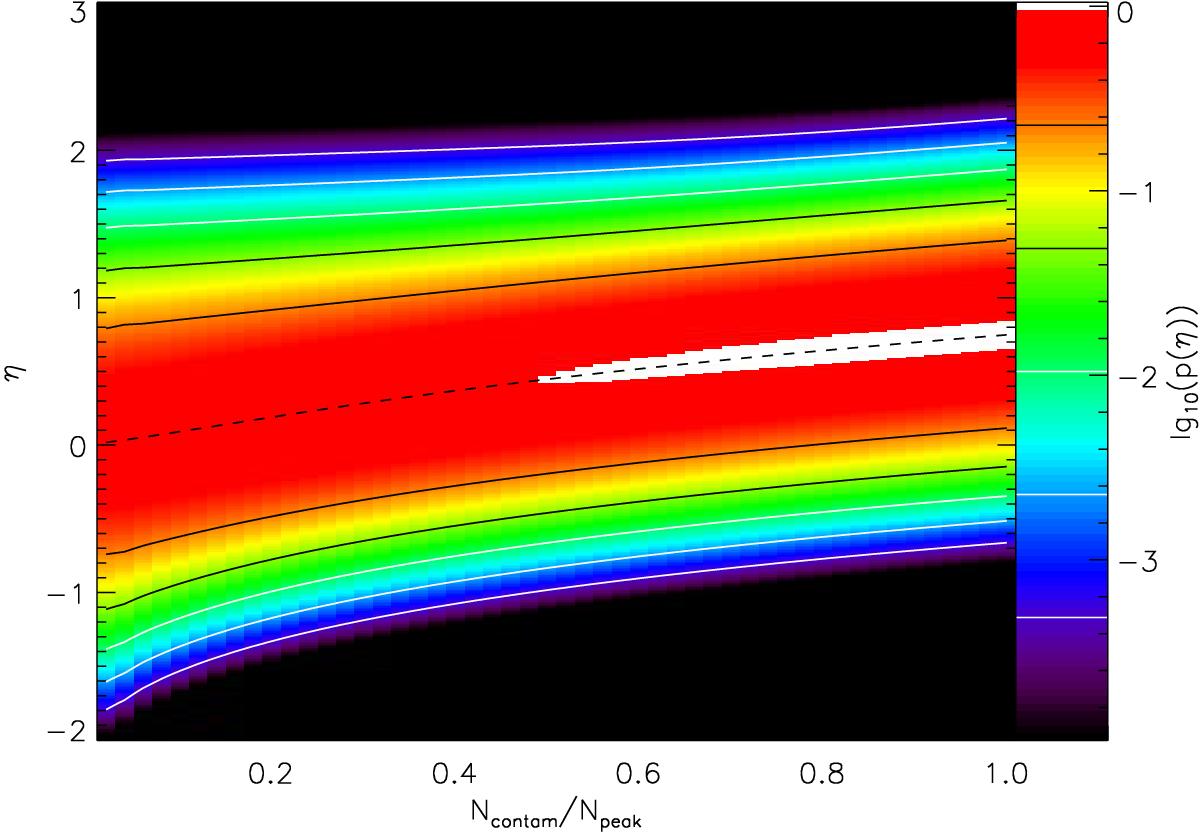
Fig. 12

Distributions obtained from the convolution of a log-normal cloud PDF (Eq. (2), ση,cloud = 0.5) with a second log-normal PDF (Eq. (6), σcontam = 0.5) as a function of the typical density of the contaminating structure, Ncontam, relative to the peak of the log-normal cloud distribution, Npeak. The left edge of the figure represents the original cloud PDF shown in colors of the logarithm of pη. When increasing the contamination level Ncontam in the right direction, we see the shift of the PDF towards higher logarithmic column densities, η.
Current usage metrics show cumulative count of Article Views (full-text article views including HTML views, PDF and ePub downloads, according to the available data) and Abstracts Views on Vision4Press platform.
Data correspond to usage on the plateform after 2015. The current usage metrics is available 48-96 hours after online publication and is updated daily on week days.
Initial download of the metrics may take a while.


