Fig. 1
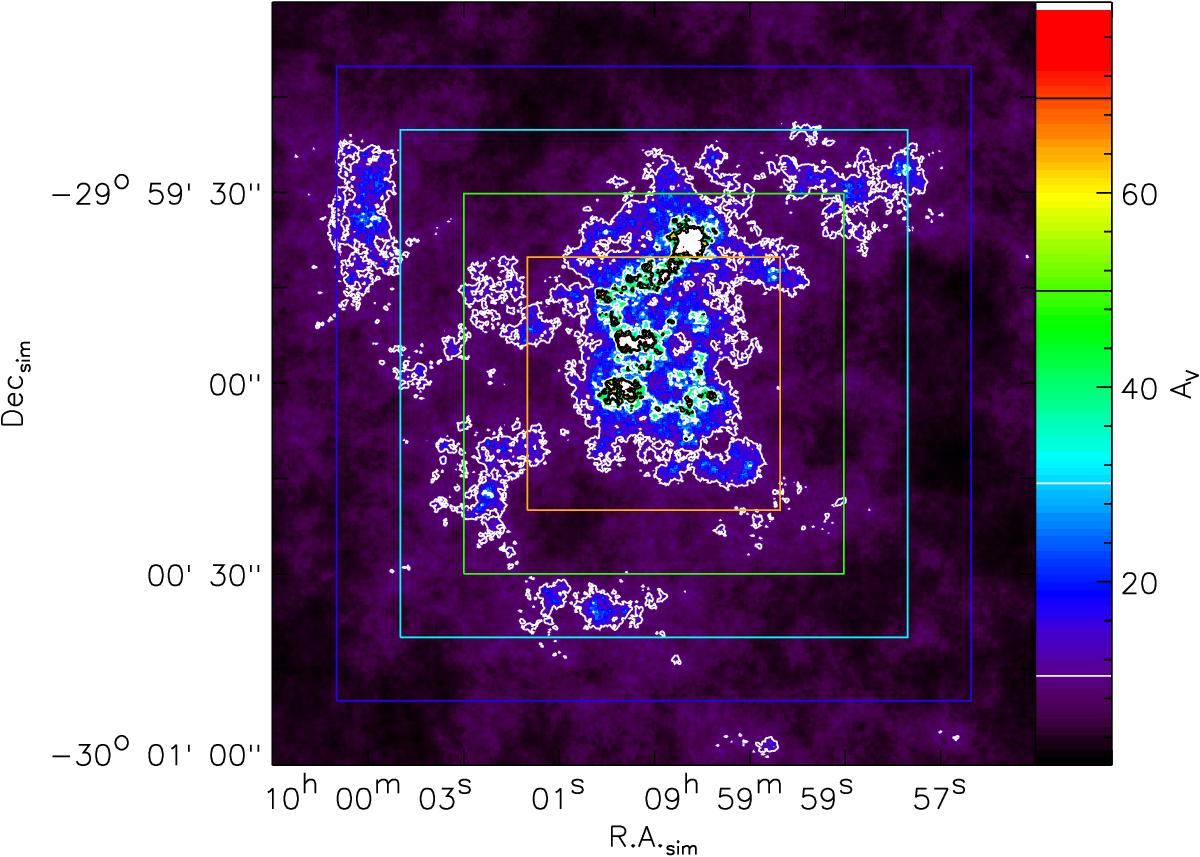
Test data set representing a fractal cloud with an ideal column density PDF consisting of a log-normal part and a power-law high-density tail. Coordinates are invented to allow for an easy comparison with real observations and to perform simulated ALMA observations in Sect. 6. Contours and colors visualize the same data. The contour levels are indicated in the color bar. Column densities above AV = 80 are saturated in the plot to make the turbulent cloud part better visible. The actual maximum column density is three times larger. As the peak of the log-normal PDF is located at AV = 5, the contours almost cover material in the PDF power-law tail only. Because of the low probabilities in the tail, the fraction of green pixels is already small and that of pixels with yellow and red colors is tiny. The four colored squares indicate the subregions discussed in Sect. 5.
Current usage metrics show cumulative count of Article Views (full-text article views including HTML views, PDF and ePub downloads, according to the available data) and Abstracts Views on Vision4Press platform.
Data correspond to usage on the plateform after 2015. The current usage metrics is available 48-96 hours after online publication and is updated daily on week days.
Initial download of the metrics may take a while.