Fig. 8
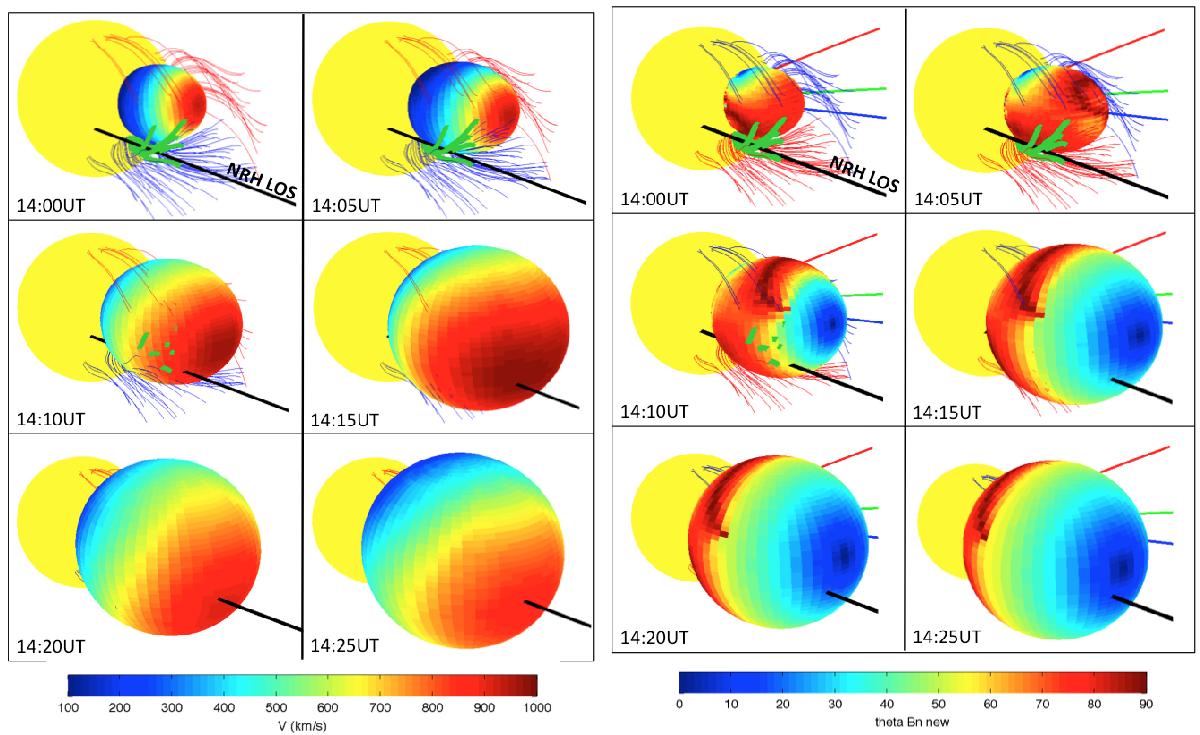
3D evolution of the CME at different times from 14:00 UT to 14:25 UT. The color code shows the distribution of the speed (left panel) and the angle between the normal on the front and the direction of the upstream magnetic field lines (right panel). The open magnetic field lines are plotted in red (positive polarity) and blue (negative polarity). The thick black line is the line of sight (LOS) from Earth to the type III source at 150 MHz. The green lines are the open field lines intercepted by the LOS.
Current usage metrics show cumulative count of Article Views (full-text article views including HTML views, PDF and ePub downloads, according to the available data) and Abstracts Views on Vision4Press platform.
Data correspond to usage on the plateform after 2015. The current usage metrics is available 48-96 hours after online publication and is updated daily on week days.
Initial download of the metrics may take a while.